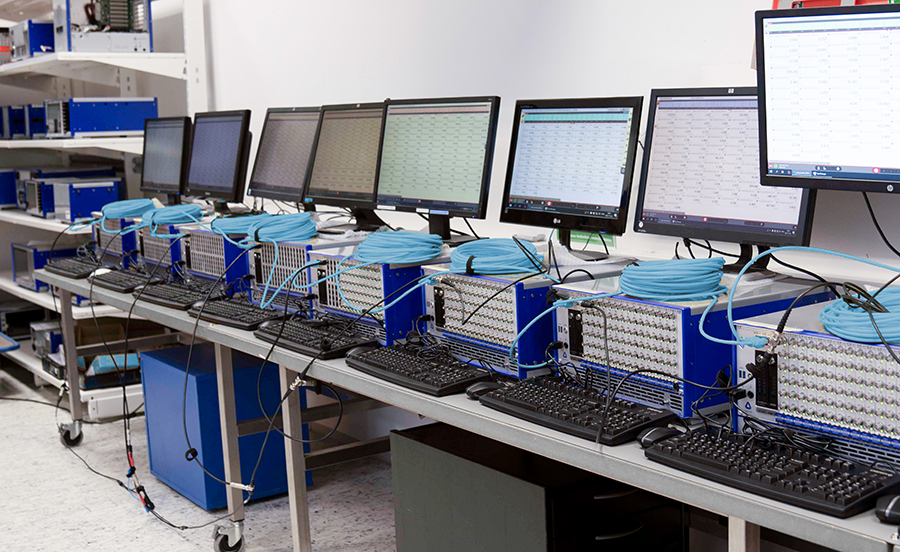
The DEWETRON recorder instrument and it's functionalities
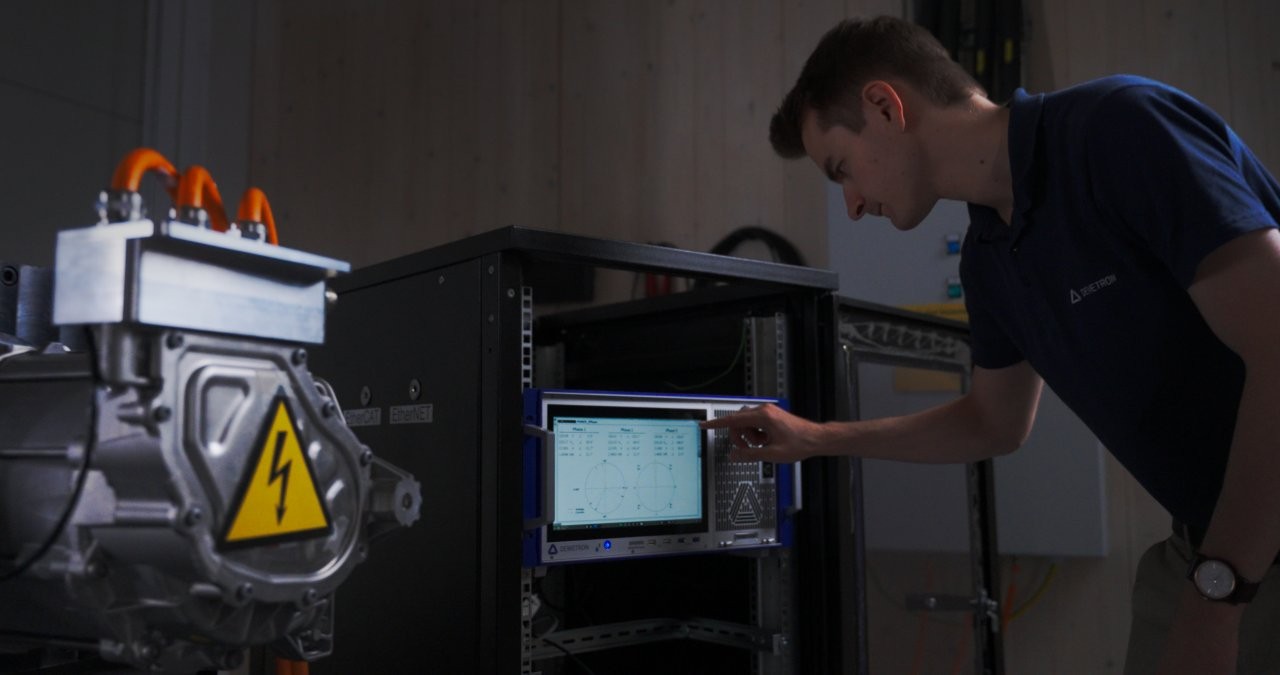
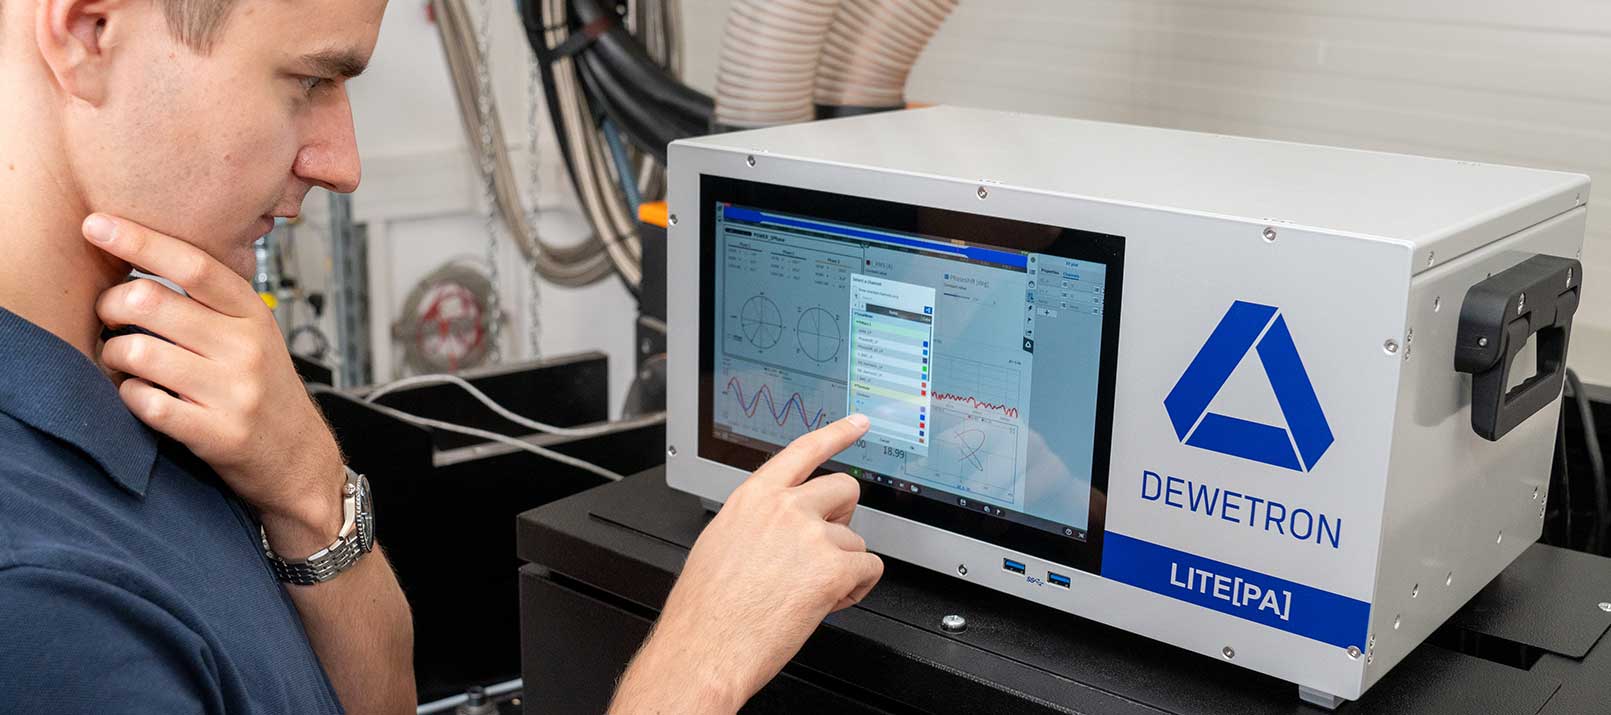
One of the core features of our measurement software OXYGEN is the recorder instrument. The OXYGEN recorder replicates the functionality of a strip recorder. It offers many features for signal analysis for an intuitive workflow with your data. Continue reading to get to know more useful features of this powerful feature.
Functionalities of the recorder
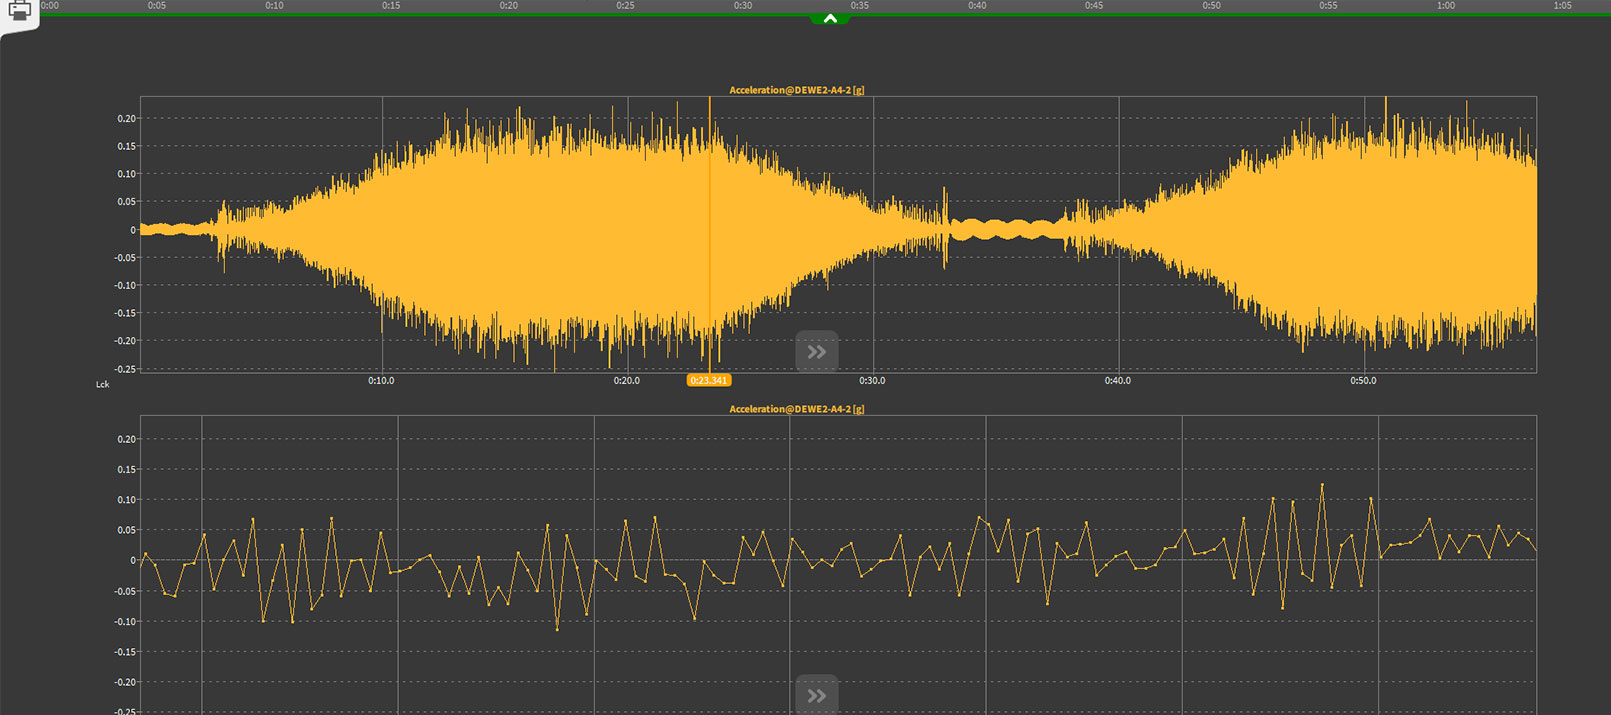
You can assign up to 8 channels to one single recorder to display their time dependent trend. The single signals can either refer to one common Y-axis or be scaled individually. The time base can refer to the relative recording time or to the absolute time. With the option to show “statistics data only” you get a detailed look into the statistic trend of your measurement data.
The DejaView feature
“Déjà vu” means to feel a moment as if it already happened in the past. The so called DejaView feature works similar. This is one of the most powerful recorder features. It allows the user to review and analyze recorded data the recording itself is still ongoing. This is a very useful feature because it even works during long duration recordings. DejaView allows the user to review the actual measurement data without having to stop the measurement before.
Activation of Cursors
When analyzing data, you can activate the A/B and C/D cursors for detailed signal analysis. The cursors provide Min, Max, RMS any many more signal analysis options and give a further look into your data. The cursors are commonly used and also very popular along with OXYGENs Reporting feature.

Export Active Recorder region
When you want to export data, the Recorder can also be a big help. In many cases, it is not desired to export the entire measurement data from Recording start to end but only from a certain time span. The recorder can be used to select this specific time span and allows the user to export only the data related to this specific section. The “Export Active Recorder” option can also be applied during the video export of your measurement screen.
Zooming into your data
The Recorder provides several intuitive options to zoom into your data not only during data analysis but also in recording mode. The signal overview of the entire measurement is just a few clicks away from the detailed analysis of each single sample.
Users working with touch screens can use pinch and zooming gestures that are common from smart phone usage to zoom into and scroll through the data.
The next section includes a very useful hint when you work with several recorders in parallel.
How to link the time axis of several recorders
Our followers on LinkedIn might already know the possibility to link adjacent recorders from our last tutorial video. This hack in OXYGEN links the time axes of several recorder on the same screen. This simplifies time zooming operations with several recorders. It is very easy to us and can be selected in the Link mode dropdown menu available in the Instrument properties.
Watch our tutorial video to get a practical explanation:
You are currently viewing a placeholder content from YouTube. To access the actual content, click the button below. Please note that doing so will share data with third-party providers.
More InformationLast but not least another new and minor OXYGEN 5.5 feature with impact on data analysis. The Show data labels option opens a mouseover window to display measurement value and time of the actual mouse position: