What is CPB-analysis?
In measurement technology there is a multitude of analysis and evaluation techniques. Well-known examples are the spectral analysis with FFT, the determination of AVG and RMS or the creation of performance curves. One of the less known (but not less useful) methods is the CPB analysis, which we are going to explain in more detail in this article.
CPB analysis, what is it?
CPB is an abbreviation and stands for constant percentage bandwidth. But what does it mean? Let’s approach the subject by analyzing the terms one by one:
- Bandwidth: The bandwidth describes an environment around a chosen center value. A bandwidth of ±4 Hz around a center value of 40 Hz means that we consider values in the range of 36-44 Hz.
- Percentage: The percentage bandwidth is not given in the form of absolute values such as ±4 Hz, but as a percentage around the center value. In our example, the percentage bandwidth would be 10 % of 40 Hz.
- Constant: Constant means that the bandwidth is the same for all measured values. If we consider a constant percentage bandwidth of 10 %, this would correspond to a range of 36-44 Hz for a center value of 40 Hz. However, with a center value of 80 Hz, the same constant 10 % bandwidth would cover a range of 72-88 Hz.
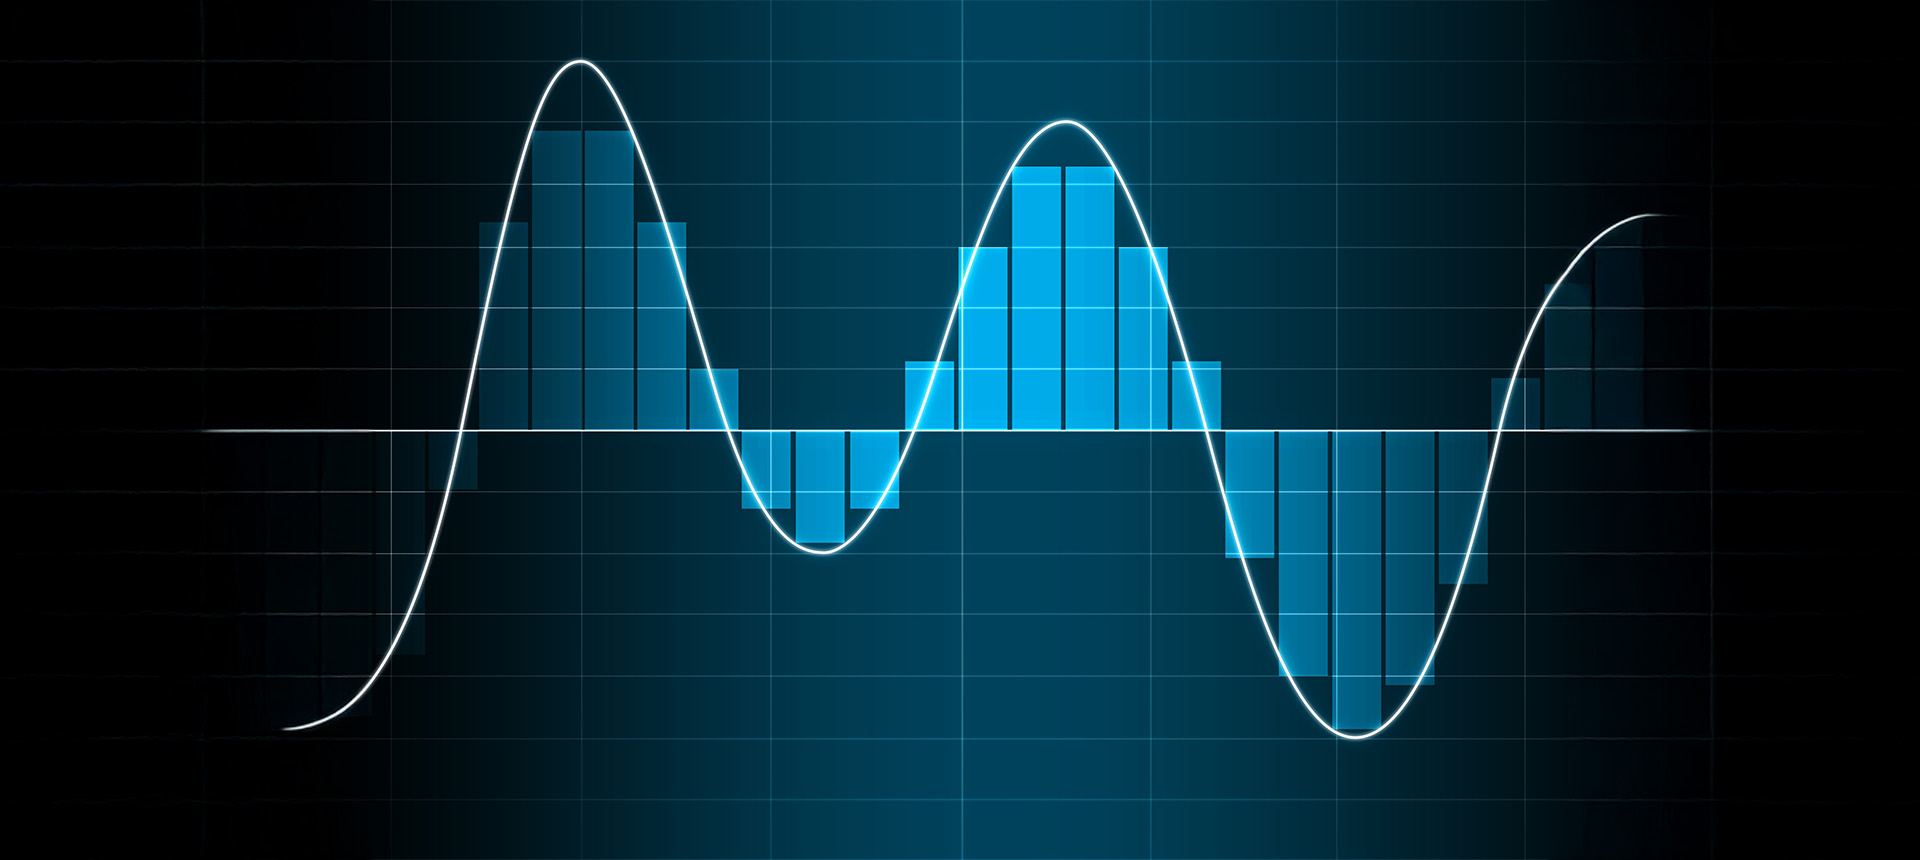
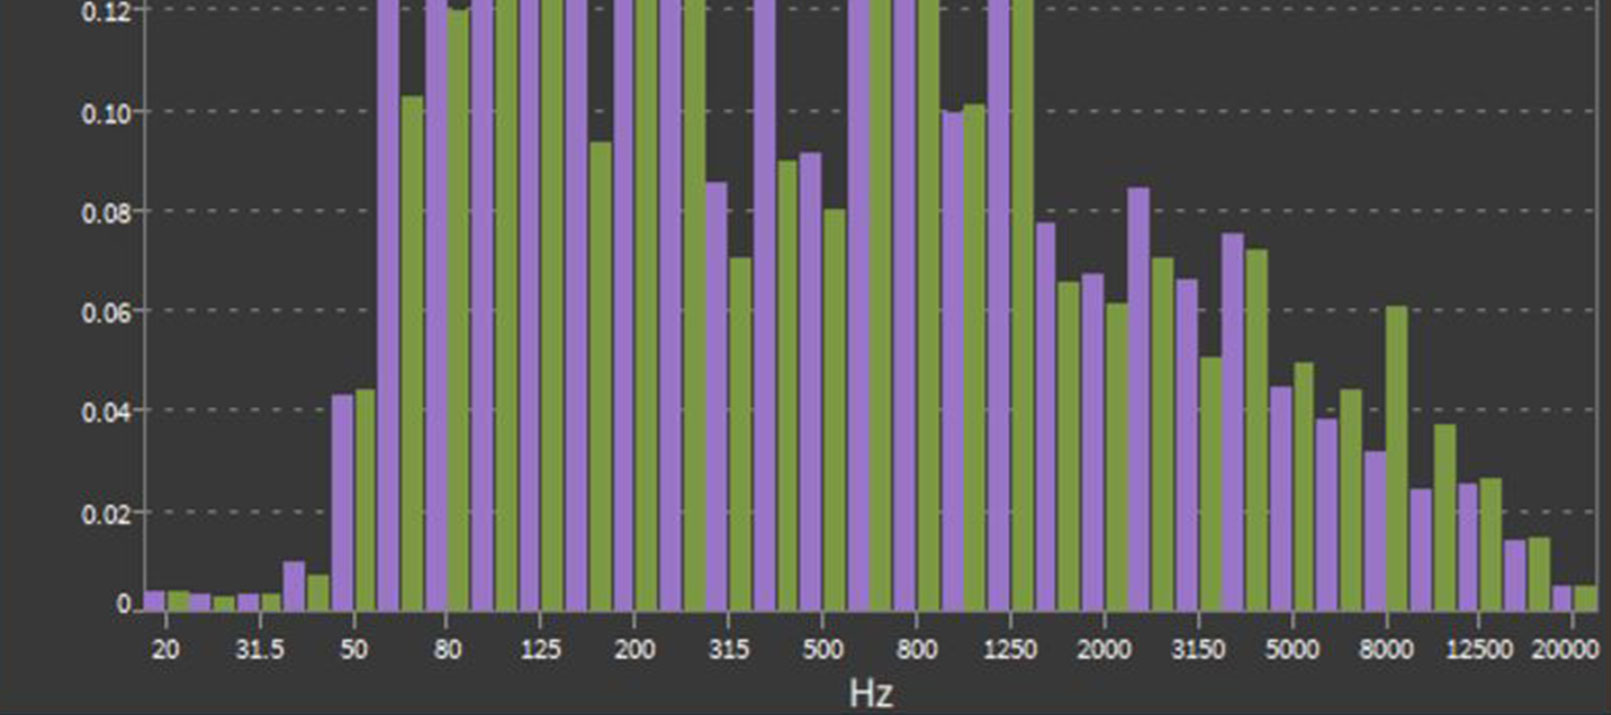
So much for the theory, but what does a CPB spectrum look like in practice? A CPB spectrum is usually displayed as a histogram, where the width of the individual bars corresponds to the constant percentage bandwidth. The height of the bars indicates the number of measured values in the given range.
To illustrate this, consider the figure below. Here you can see a CPB spectrum with a bandwidth of 10 %. One usually scales the x-axis logarithmically, otherwise the bars become wider as the frequencies increase (10 % of 80 Hz is wider than 10 % of 40 Hz).

Example of a CPB spectrum
Applications and alternatives
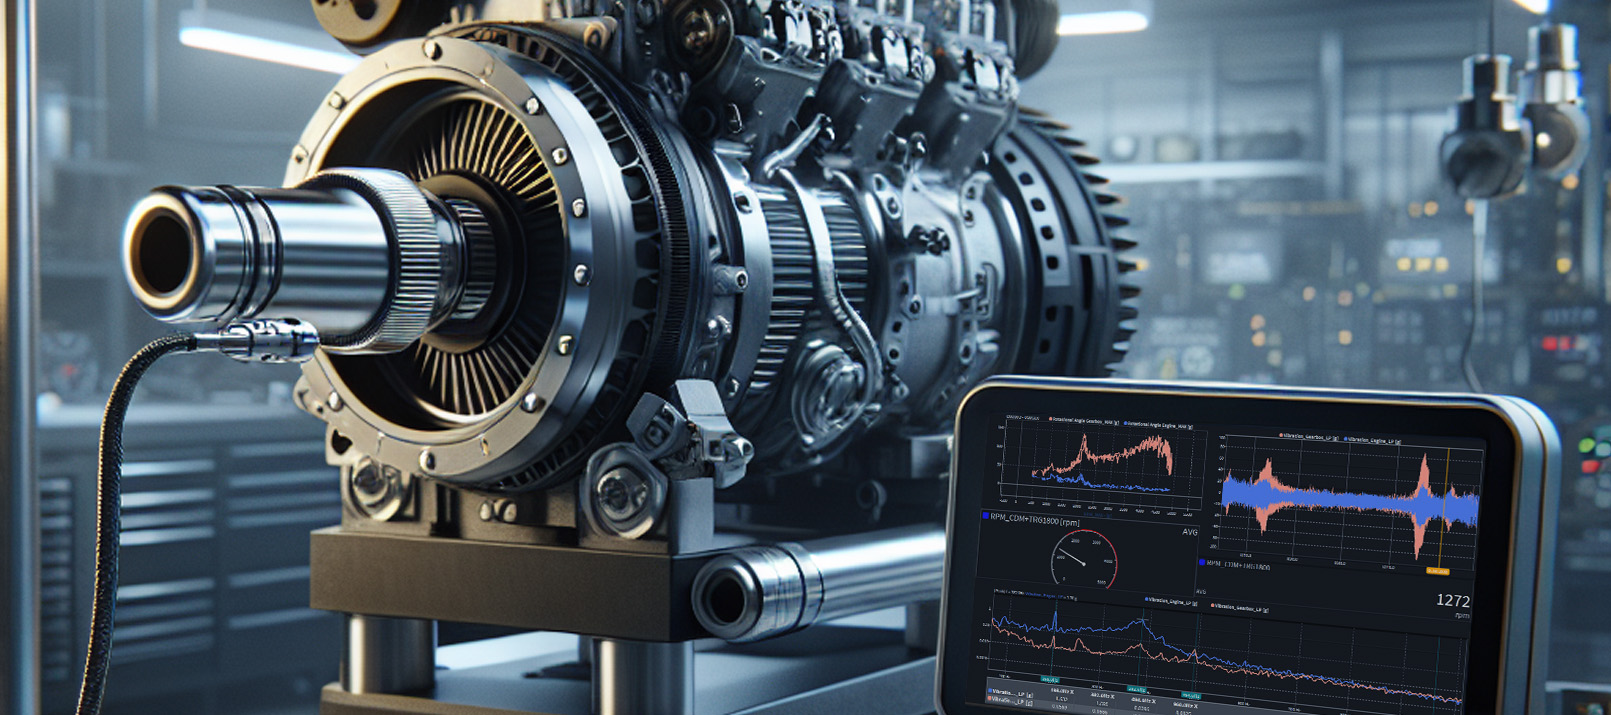
What may have sounded very theoretical in the chapter above has many applications in acoustic and vibrational engineering. For example, CPB analysis is one of the fastest and most economical methods to detect machine malfunctions. Unbalance, misalignment or coupling problems usually show up in sharp peaks at low frequencies. It is precisely at these low frequencies that CPB analysis offers its highest accuracy.
On the other hand, there is also noise at high frequencies, which usually extends over a wide frequency range. This correlates primarily with lubrication and friction problems. The CPB analysis offers only a low resolution in this higher frequency range, but this is sufficient for a broadly distributed noise and thus saves computing power and memory.
These advantages are especially noticeable when comparing the CPB analysis with the very similar fast Fourier transform analysis (FFT). In an FFT analysis, the corresponding amplitude is calculated for each frequency, and this is done with the same accuracy at both low and high frequencies. Accordingly, the FFT is very inefficient when high resolution is not necessary. In contrast, however, the FFT contains a large amount of diagnostic data that one can read out with high accuracy. This is essential for some applications, such as the determination of harmonic oscillations.
OXYGEN – CPB analysis made easy
When analyzing frequencies, we often talk about octave resolutions. An octave is a term that has its origin in music and defines a frequency spectrum. An octave comprises eight tones, with the eighth tone having twice the frequency of the first. This octave scheme has been adopted by technicians to indicate bandwidths in CPB analysis.
The OXYGEN software developed by DEWETRON is perfectly suited for CPB analysis. OXYGEN offers you a choice between octave, third octave or twelfth octave band resolution defined according to EN61260. It is also possible for you to define a maximum frequency and implement A, B, C or D frequency weighting. The result is an amplitude or decibel spectrum with freely defined reference value and level.
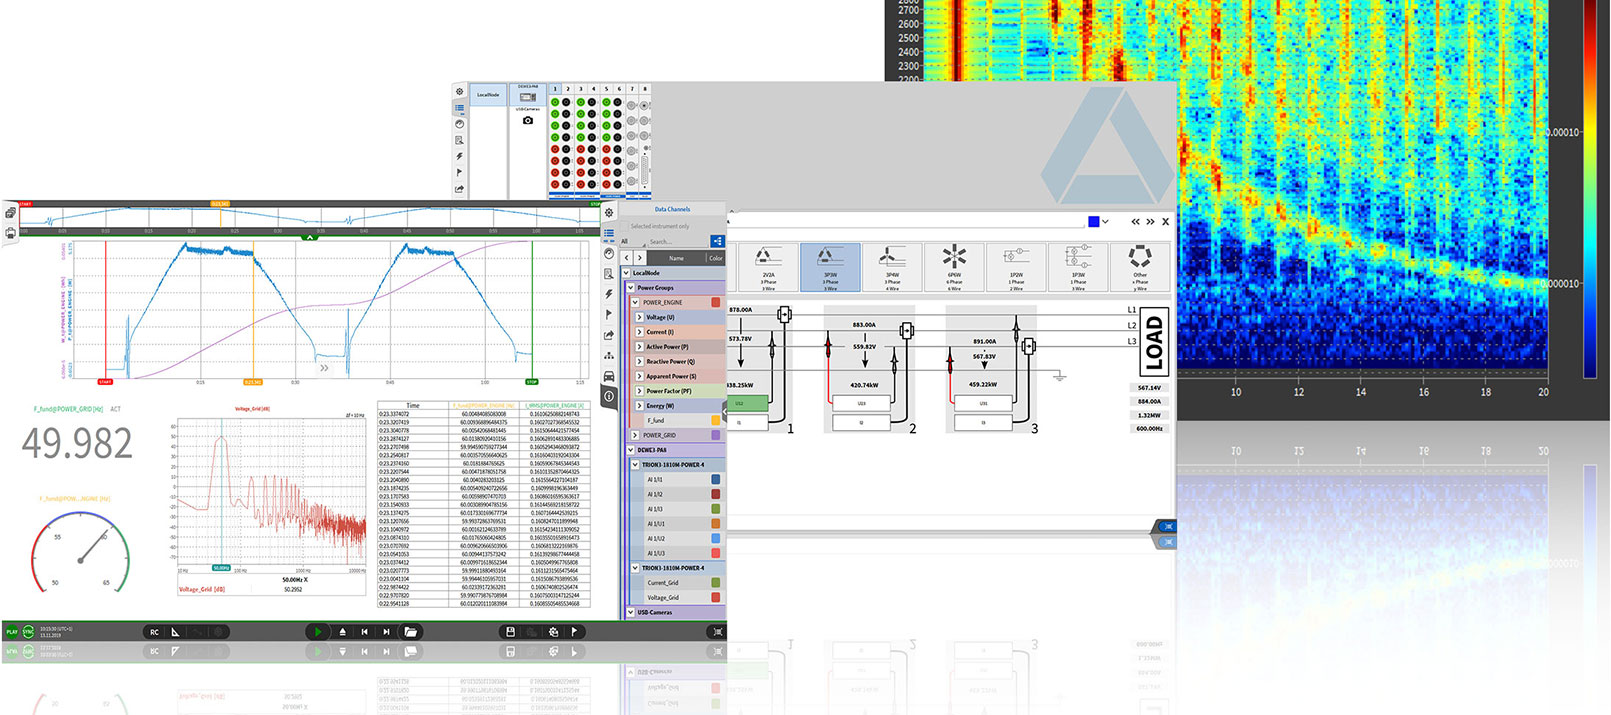
In addition, you can also use OXYGEN to calculate and output the energetic sum over all measurement bins or the values averaged over the measurement time. How such a measurement can look like is up to you because you can design the interface according to your wishes. You can see an example here:

Measurement screen for a CPB analysis in OXYGEN
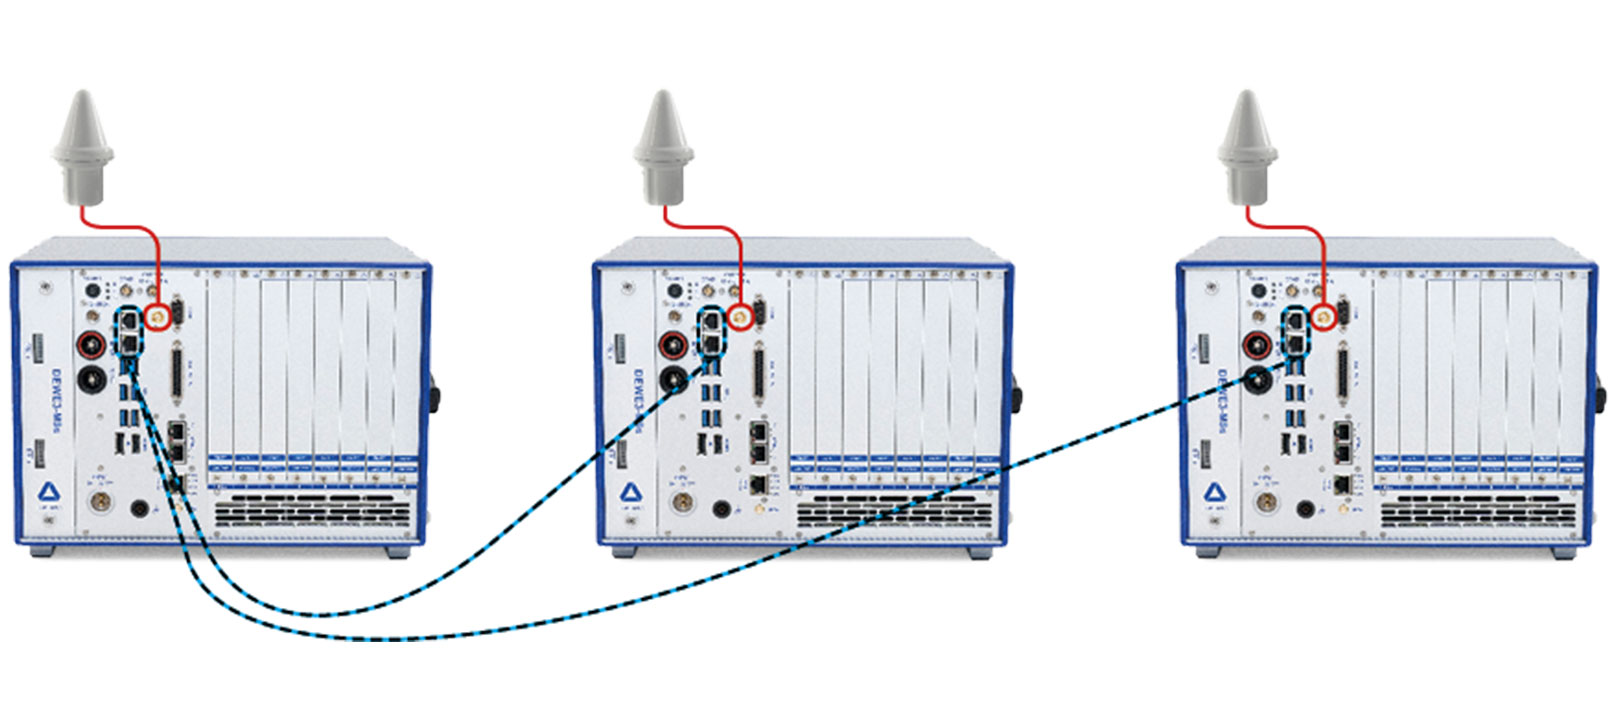
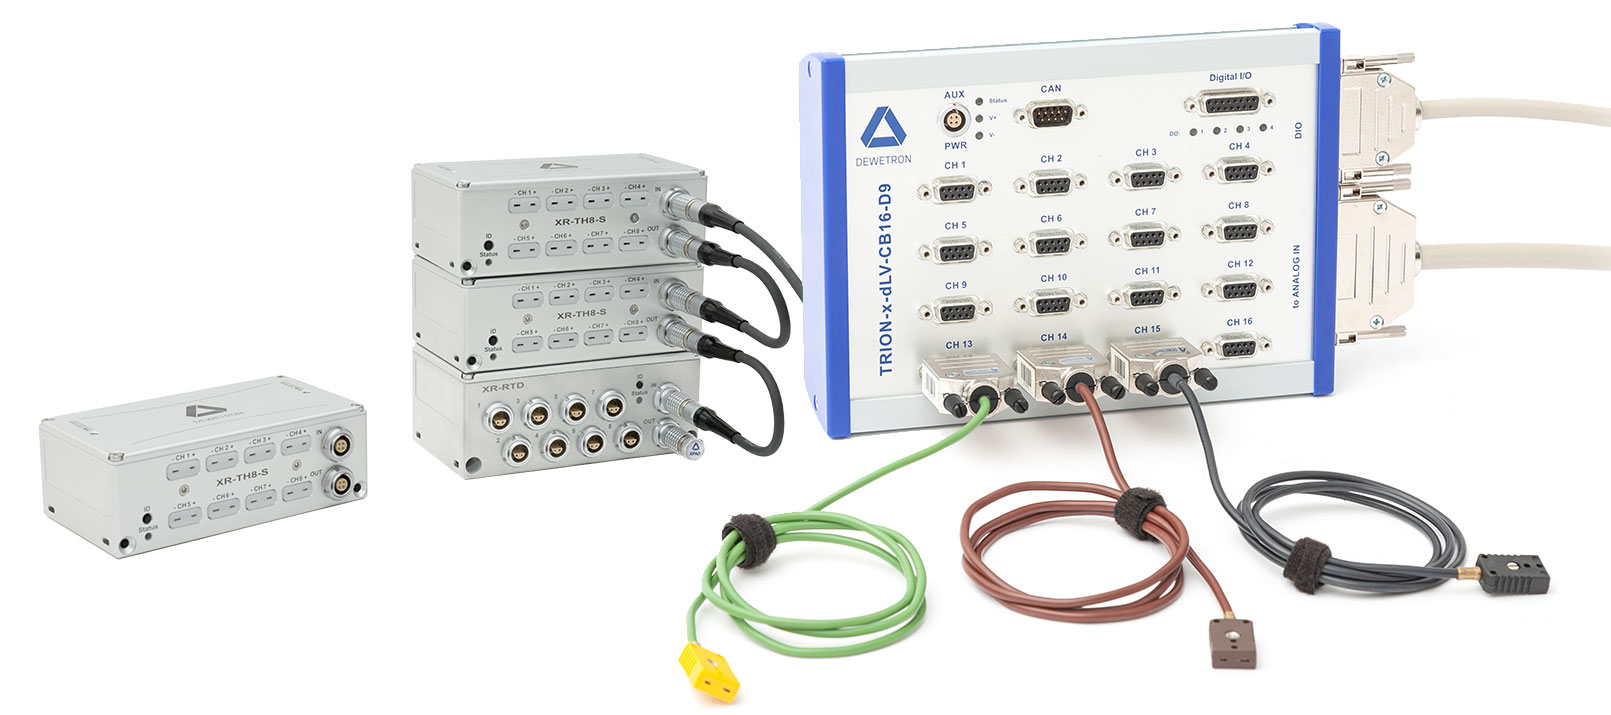
For the analysis of oscillations and vibrations we offer not only our OXYGEN software, but also a variety of test and measurement systems. You can find our DAQ systems here. More blogposts or also webinars, whitepapers and video tutorials can be found on our DEWETRON website. We are also regularly active on Twitter and LinkedIn. Follow us there if you do not want to miss any news.