What is statistical data analysis?
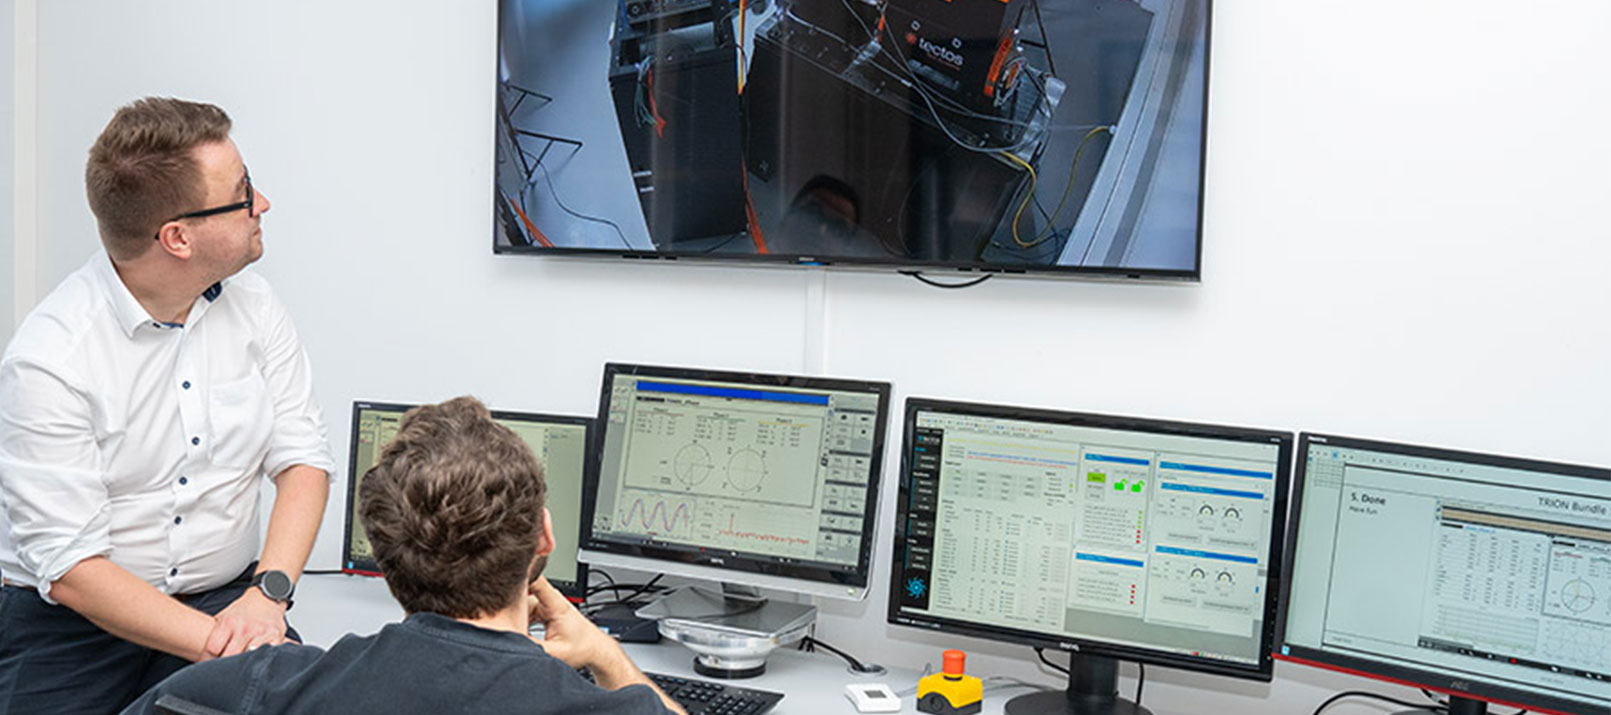
Advanced measurement setups generate huge amounts of data, yet raw values alone rarely tell the full story. Statistical analysis helps transform this data into a clear, informative picture by providing meaningful summaries, revealing patterns, and even enabling predictions about future behavior. Below, we explore the basics of statistical data analysis and take a look at the statistical tools available in our measurement software OXYGEN.
What is statistical data analysis?
Statistical data analysis is the process of examining, transforming, and interpreting measurement data to uncover patterns, quantify variations, and support objective decision-making. Instead of relying on single values or visual inspection, statistical analysis provides a mathematical foundation for understanding how systems truly behave.
Although there are countless statistical methods and analysis techniques, they are usually divided into two fundamental categories:
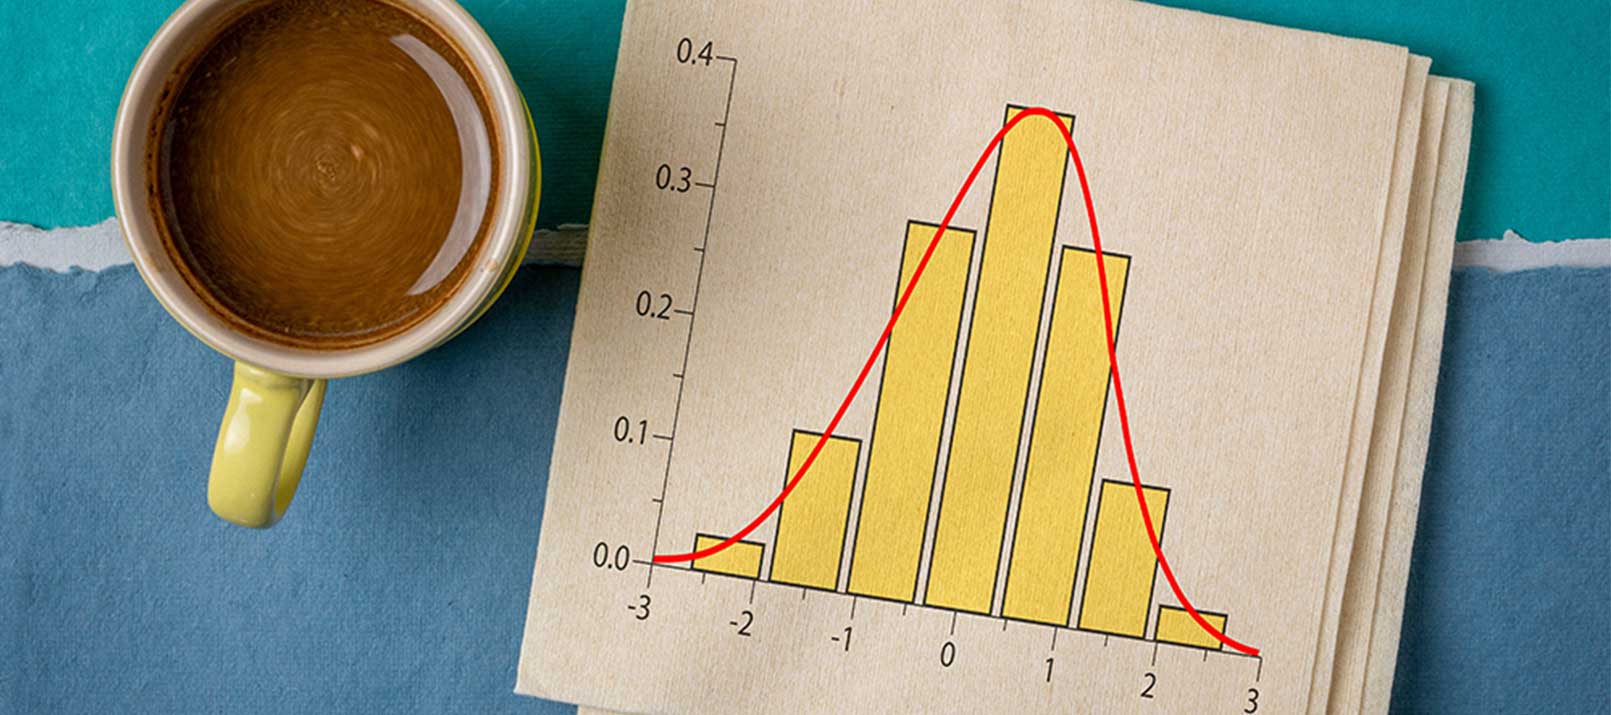
- Descriptive statistics – These methods summarize and describe the main characteristics of a dataset. They focus on what the data shows: averages, variation, ranges, percentiles, distributions, and other metrics that help to understand the behavior of measured values.
- Inferential statistics – These methods go a step further by drawing conclusions beyond the observed data. They use probability theory, models, and sample data to make predictions, estimate parameters, or test hypotheses about a larger system or population.
| Aspect | Descriptive statistics | Inferential Statistics |
| Purpose & goal | Describes and summarizes observed data. | Concludes or makes predictions beyond observed data. |
| Typical outputs | Mean, median, min/max, standard deviation, percentiles, distributions | Confidence intervals, hypothesis tests, probability estimates, regression models |
| Example methods | Histograms, correlations, Boxplots, basic regressions | Bayesian statistics, t-tests, chi-square, advanced regressions, predictive modeling |
| Dataset | Requires the full dataset | Requires a sample to infer broader behavior |
| Risk | Low – purely descriptive | Higher –includes confidence and probability |
| Assumptions | Few assumptions; purely data-driven | Relies on probability models and assumptions about the data |
| Use cases | Summarizing signals, identifying trends or anomalies | Predicting system behavior, estimating performance limits |
Tab. 1: Basic comparison of descriptive and inferential statistics.
Why and where is statistical analysis used?
Simply put, statistical analysis is valuable wherever data needs to be interpreted, compared, or used to make decisions. In theory, measured values would be perfectly stable and accurately represent the underlying process. In reality, real-world data is messy: noise, fluctuations, environmental influences, and dynamic system behavior all impact the results. Statistical tools help you make sense of this complexity.
Different industries face different challenges and therefore rely on different statistical methods. Below are several examples showing how various fields use specific techniques to extract meaningful insights from their data.
Automotive Testing
- Evaluate repeated maneuvers using percentiles to compare driver variability
- Assess NVH and vibration levels using RMS and standard deviation
- Analyze brake performance trends using min/max and time-series statistics
Power & Energy
- Check long-term grid stability using moving averages and trend analysis
- Analyze load cycles using cycle-based statistics (min, max, avg per cycle)
- Detect unusual operating conditions using histograms and distribution analysis
Aerospace & Defense
- Evaluate structural loads with peak statistics
- Use Bayesian estimation to update probabilities of component failure
- Analyze vibration behavior using spectral statistics and variance metrics
Manufacturing & Quality Control
- Monitor process consistency using standard deviation and control limits
- Spot anomalies with boxplots or percentile ranges
- Compare batches with correlation or simple hypothesis tests
Research & Development
- Explore parameter relationships with regression analysis and correlations
- Identify noise patterns using distribution analysis or RMS metrics
- Validate theoretical assumptions using hypothesis testing or Bayesian inference
Long-Term Monitoring & Field Data
- Summarize huge datasets into meaningful insights using descriptive statistics
- Detect slow degradation trends with moving averages
- Identify rare events using histograms, outlier detection, or threshold statistics
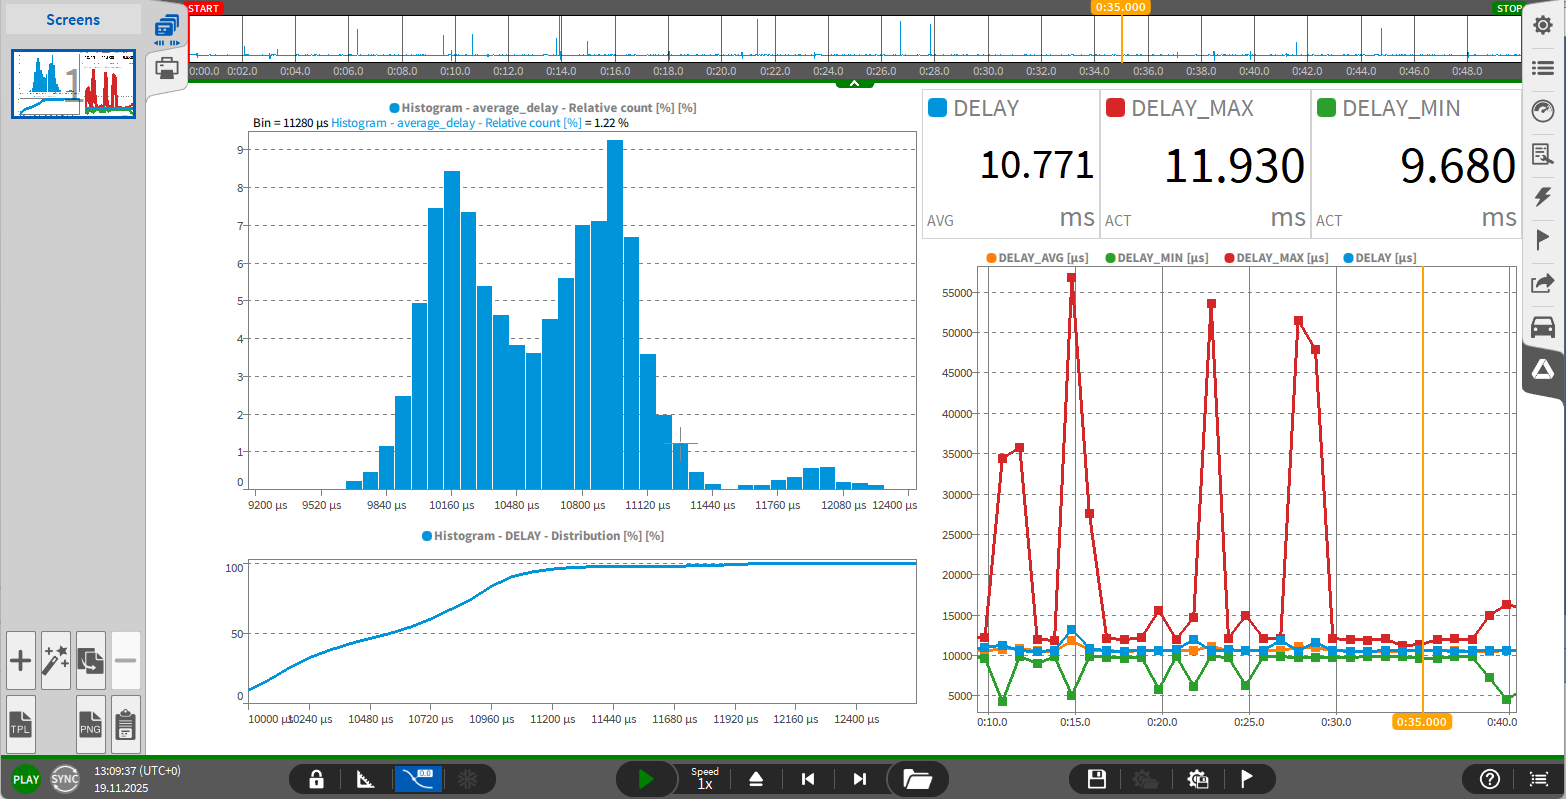
Fig. 1: Statistical evaluation of network transmission delay with OXYGEN
How to do statistical data analysis with OXYGEN
Our measurement software OXYGEN provides a broad range of analysis tools for many applications – from simple frequency evaluations to advanced power analysis, shock response calculations, and more. Within this toolbox, OXYGEN also offers extensive statistical analysis features, especially in the area of descriptive and summary statistics. Key features include:
- Basic summary metrics
- Block-based and running statistics
- Triggered statistics for event-based evaluations
- Overall measurement statistics
- Array statistics
- Histograms
- Correlation
- … and several additional functions for test & measurement workflows.