OXYGEN 7.7 - Smarter Data Acquisition with New Features & Improvements

With OXYGEN 7.7, we continue to refine our powerful data acquisition software. This update introduces new features, analysis optimizations, and usability improvements across multiple modules – from FFT and power analysis to data import, math functions, and instrument handling. Discover all the details in this blog post and download OXYGEN to experience the improvements yourself.
New Features
- Chebyshev Type I & II Filters
- FFT Extensions
- Array Statistics
- Power Extensions
- Data Import Enhancements
- Additional Upgrades & Enhancements
Chebyshev Type I & II Filters
The latest update to the IIR Filters Plugin introduces two new filter characteristics: Chebyshev Type I and Chebyshev Type II. Both types include two filter-specific parameters that allow for fine-tuning the filter’s behavior:
For the IIR Filters Plugin we added two new filter characteristics: Chebyshev Type I & II. These characteristics come with two filter specific settings:
- Order – The higher the order the steeper the slope and the more ripples.
- Ripple – Defines the maximum peak of the ripple.
Chebyshev Type I and Type II filters are available for all filter types within the plugin.
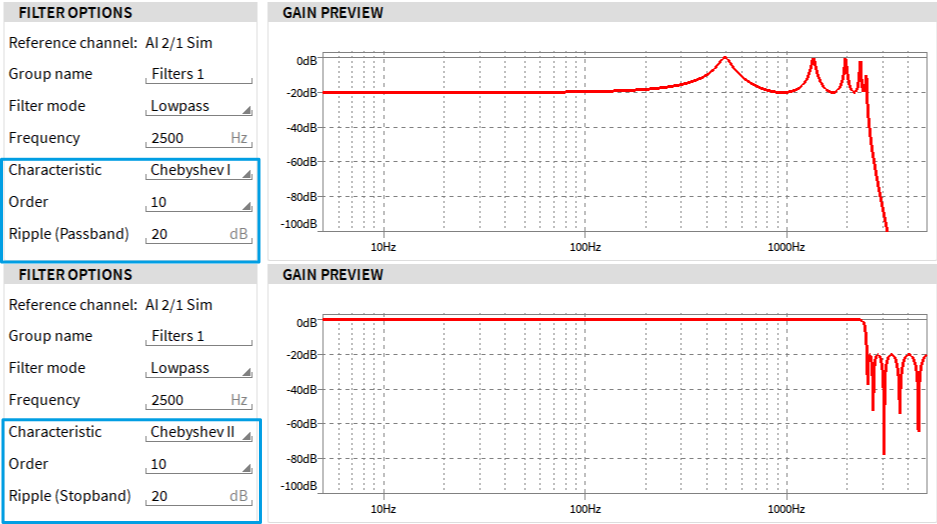
Fig. 1: Chebyshev I & II filter characteristics for IIR filter
Comparison: Chebyshev vs. Bessel & Butterworth
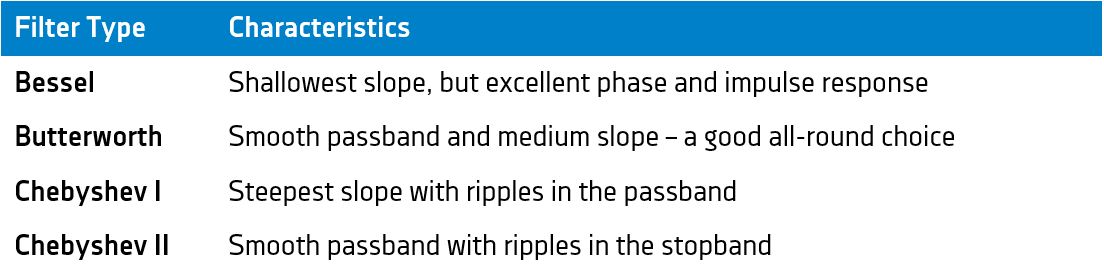
Tab 1: Comparison: Chebyshev vs. Bessel & Butterworth
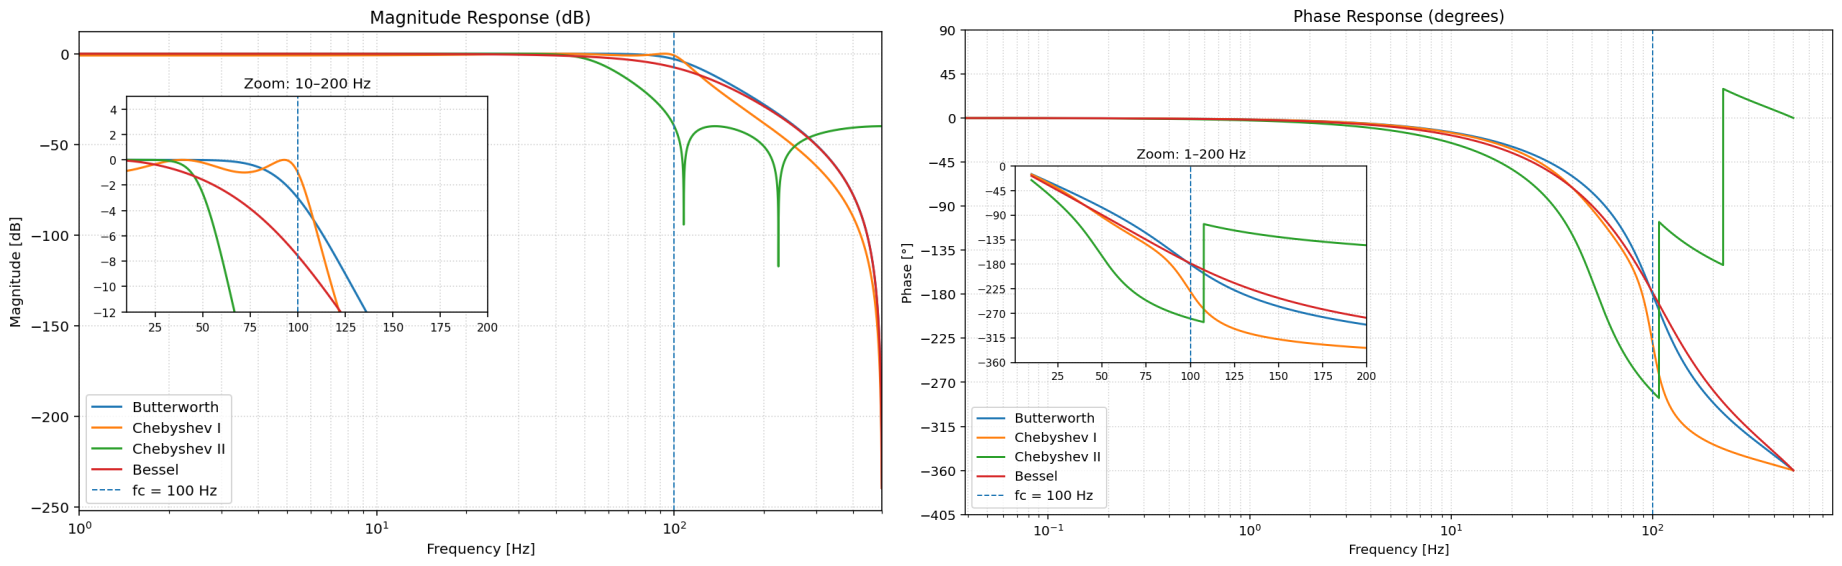
Fig. 2: Magnitude and phase response of various filter types of order 4 and a cutoff frequency of 100 Hz.
When to Use Which Filter
- Bessel – Ideal when signal shape and timing are critical.
- Butterworth – Best for general use when a clean passband without ripple is desired.
- Chebyshev I – Choose this for maximum slope, accepting some ripple in the passband.
- Chebyshev II – Perfect when the passband must remain smooth, but strong attenuation of unwanted frequencies is needed.
FFT Extensions
OXYGEN 7.7 introduces multiple extensions to our FFT tool, improving flexibility, precision and usability.
New Exponential Averaging Method
The new Exponential Averaging method applies a weighted, recursive averaging approach with a decay factor. It updates the FFT spectrum average continuously, placing more emphasis on recent data depending on the selected time constant. The exponential averaging of an FFT spectrum is defined as:
yn = α * xn + (1 – α) * yn-1
α = 1 – e – (ΔT / τ)
Where:
- yn – current averaged FFT spectrum
- xn – current input FFT spectrum
- yn-1 – previous averaged FFT spectrum
- α – smoothing factor, determined by
- ΔT – sampling time interval (reciprocal of the FFT channel sampling rate)
- τ – exponential time constant (user-editable)
A smaller τ increases the impact of the newest spectra, while a larger τ emphasizes previous spectra.
New Overall Modes
We added new options for overall FFT calculations, giving you more control over how spectral data is averaged
- Overall – Calculates over the entire measurement duration from start to end (default).
- Block-based – Averages over a user-defined number of spectra.
- Time-based – Averages over a user-defined time span.
Note: The selected mode applies to all overall channels and calculations.
Definable Frequency Range
You can now limit the FFT calculation to a specific frequency range. Select any range within 0 … fs/2, where fs is the sampling rate of the input channel. This helps focus analysis on the frequency bands most relevant to your application.
Increased FFT data size
The maximum FFT data size has been increased from 220 to 224, allowing for higher frequency resolution. This improvement applies to both Spectrum Analyzer FFT (instrument) and Math FFT.
New Peak-2-Peak Amplitude spectrum
The Amplitude Spectrum options now include Amplitude P2P. This spectrum displays the peak-to-peak amplitude—that is, twice the maximum peak amplitude – for each frequency bin (except DC bin 0, which is defined as 0). Available for both Spectrum Analyzer FFT and Math FFT.
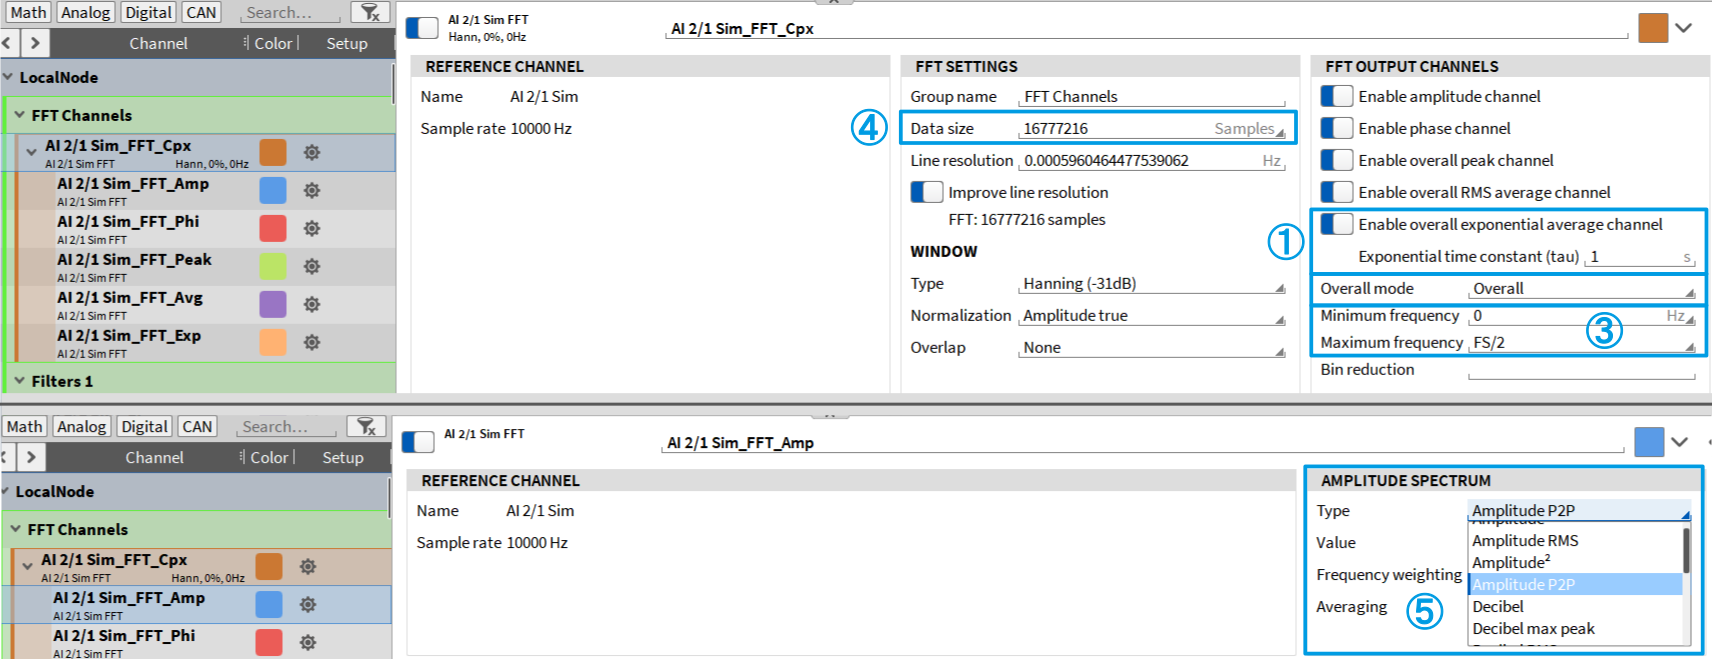
Fig. 3: New FFT improvements highlighted
Spectrum Analyzer Improvement
Within the Spectrum Analyzer instrument, the reference curves section now supports linear interpolation between two points, ensuring smoother curve visualization.

Fig. 4: Comparison between active and inactive linear interpolation
Array Statistics
Array Statistics is a new math option in our Advanced Math section, which enables a quick and efficient calculation of basic statistical values for any array channel – such as those resulting from FFT, CBP, Matrix Sampler, or similar operations.
The following statistical functions are currently available:
- Minimum value of the actual array, including the corresponding index and X-axis value in the respective Engineering Unit
- Maximum value of the actual array, including the corresponding index and X-axis value in the respective Engineering Unit
- Linear Sum across all bins
- Average across all bins
- Energetic Sum across all bins
- RMS across all bins
This function is particularly useful for identifying the current maximum value and its corresponding frequency in an amplitude spectrum.
Note: All calculated data is provided as asynchronous channels.
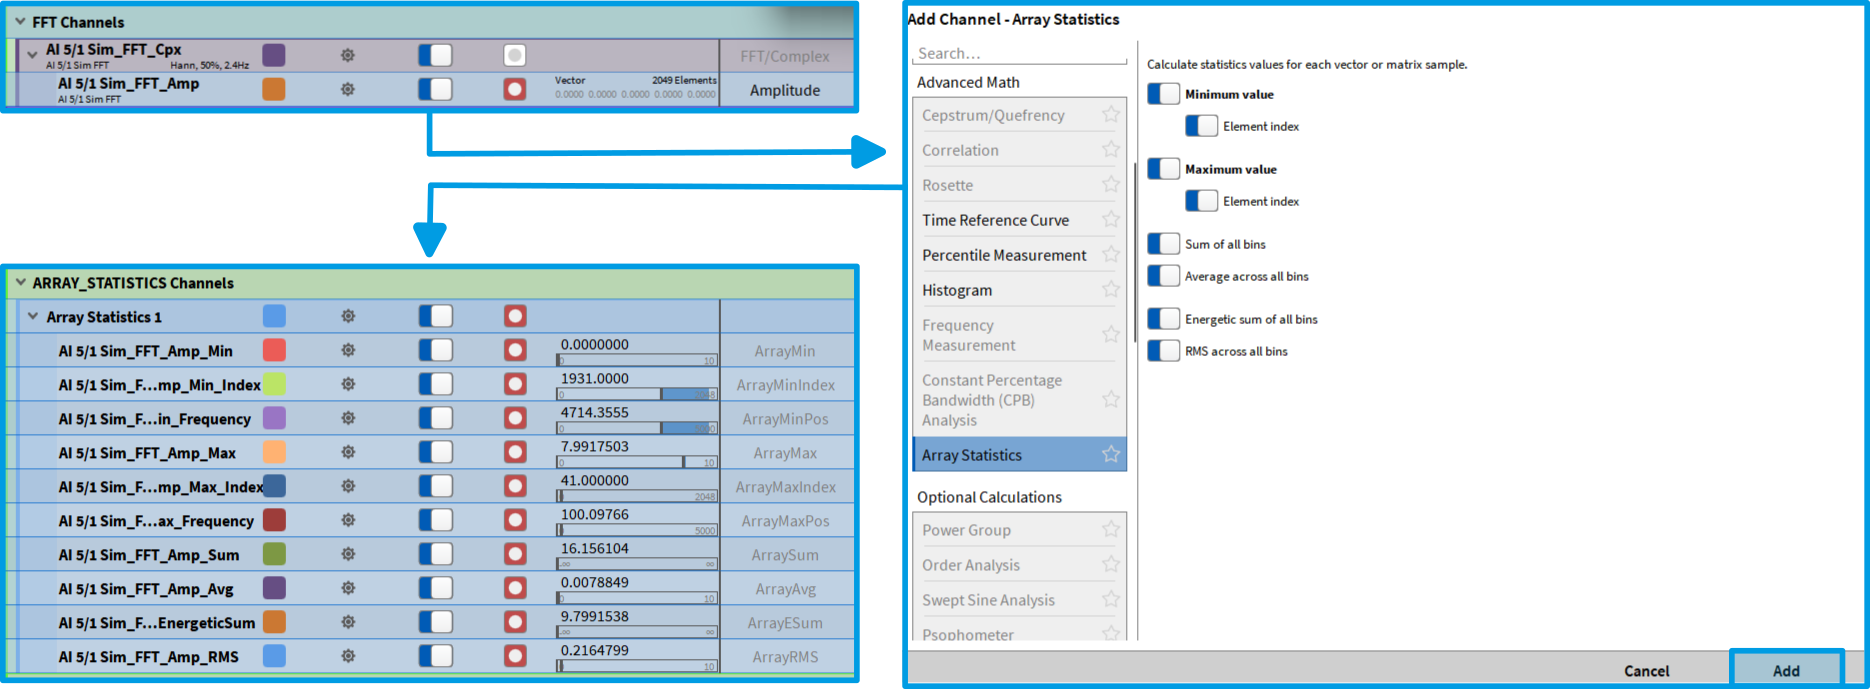
Fig. 5: Creating basic statistics based on array channels.
Power Extensions
With OXYGEN 7.7, we introduce two new updates to the Power Group:
New Harmonics Update Rate Option
In general, harmonic analysis is synchronized to N periods of the fundamental frequency. Depending on the frequency, a specific number of periods is used for the analysis. The following table provides an overview of the number of periods used for each fundamental frequency range:
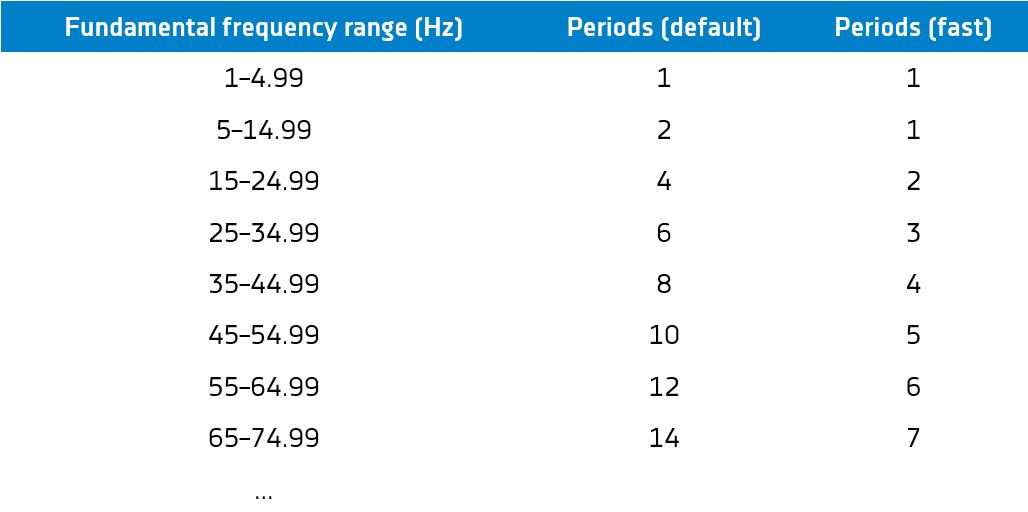
Tab. 2: Fundamental frequency range
In previous versions, this parameter was fixed. With OXYGEN 7.7, you can now choose between two harmonic update rate modes:
- Default – Standard evaluation (as previous), which resulting in longer evaluation time and higher stability, but a lower update rate.
- Fast – Halves the number of required periods, enabling quicker evaluations and faster update rates, but with reduced stability.
Improved Supraharmonics Resolution
To meet the IEC 61000-2-4 (June 2024) standard, OXYGEN now offers an option to increase the Supraharmonics resolution. Previously, supraharmonic analysis was performed with a 2 kHz bandwidth. You can now select a 200 Hz bandwidth, improving resolution by a factor of ten.
Note: Higher resolution significantly increases computational load.
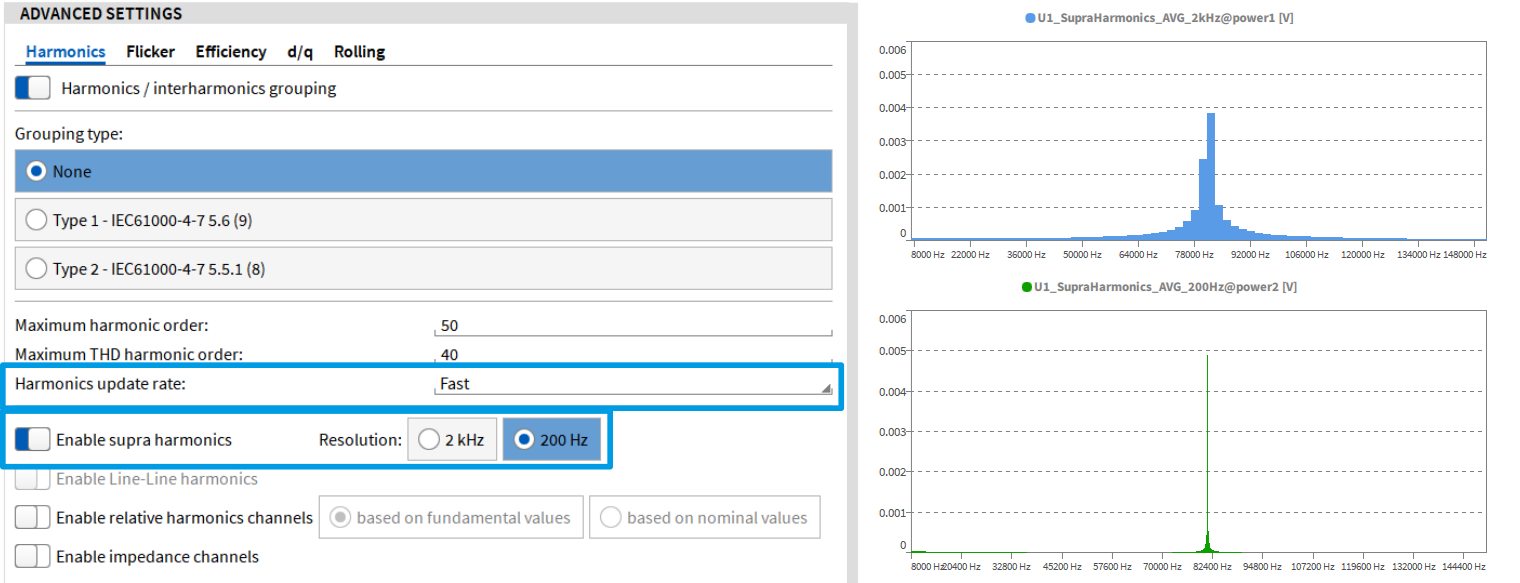
Fig. 6: Left – New harmonic settings highlighted; Right – Visual comparison of the supraharmonics resolution at 2 kHz and 200 Hz
Data Import Enhancements
This update further expands and refines the data import capabilities of OXYGEN to make working with external files more flexible:
- The CSV import functionality now also supports .txt files. When using the CSV/TXT Import option in the Add Channel menu, you can import both .csv and .txt files – with similar functionality and configuration options for both file types.
- The DXD Import feature has been enhanced with a new offset type that automatically aligns the absolute timebase of a *.dxd or *.d7d file to that of the corresponding *.dmd file. This aims to simplify the merging of multiple data sources.
- OXYGEN can now import and process third-party files that exceed the recording start or stop time of the active *.dmd file. Previously, only files within the recording timespan could be handled correctly — this limitation has now been removed for greater flexibility during post-processing and analysis.
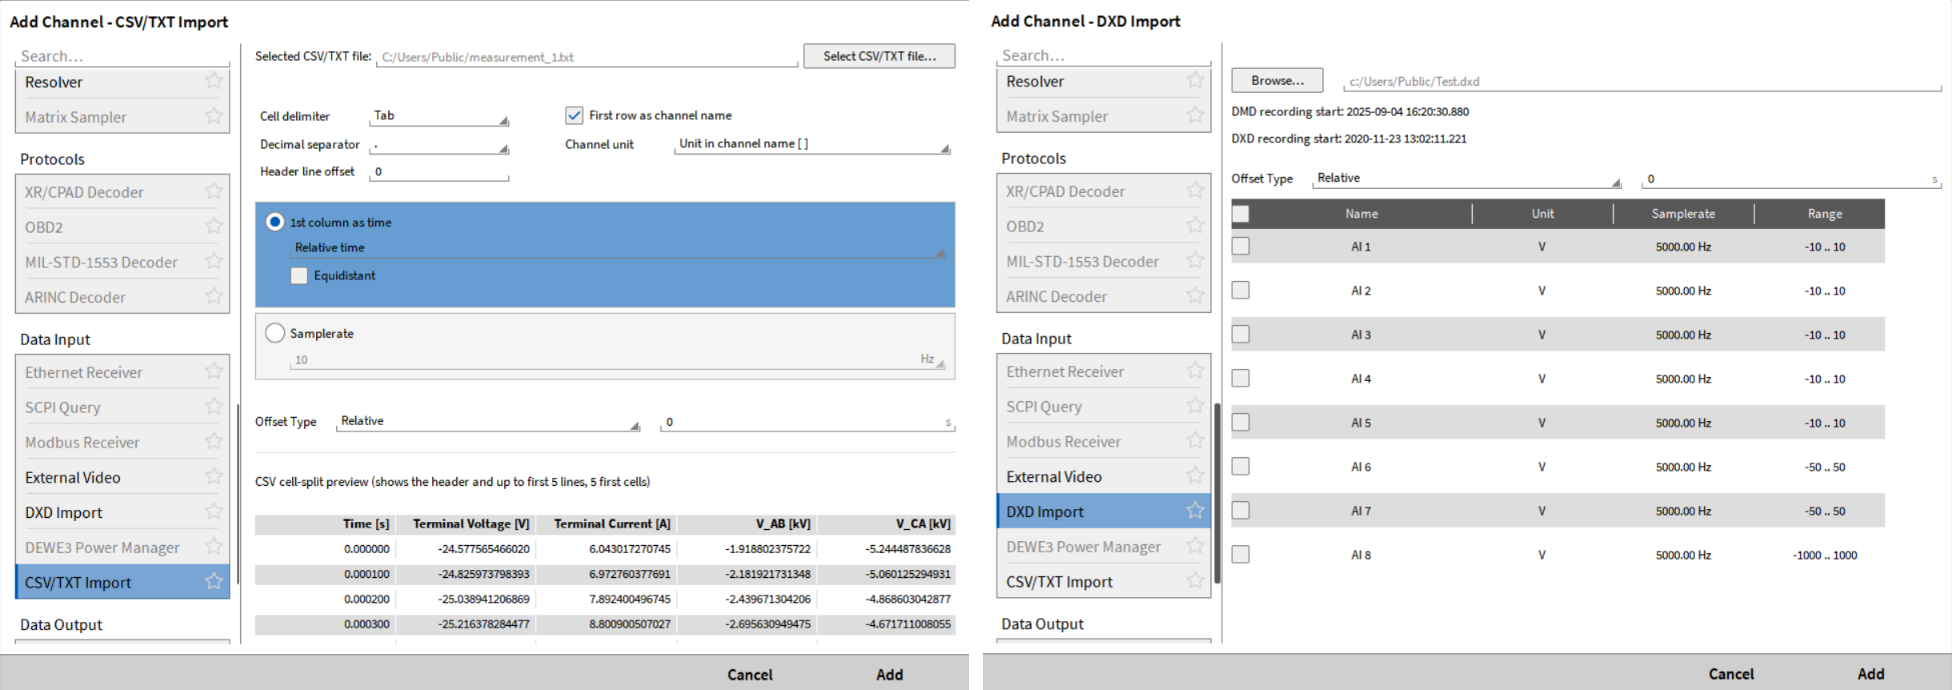
Fig. 7: CSV/TXT Import feature (left) & DXD Import feature (right)
Additional Upgrades & Enhancements
Multi-File Recording – Split by File Size
The Multi-File Recording functionality has been expanded with a new option: Split by file size. In addition to the existing split modes — Split by duration, Split by number of recording events, and Split by absolute time — you can now automatically split recordings once a defined file size limit is reached. This is especially useful for long-term recordings, ensuring manageable file sizes and easier data handling without interrupting the measurement process.
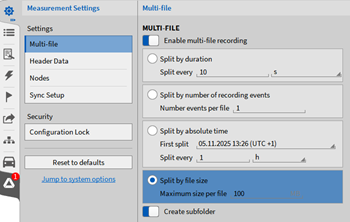
Fig. 8: New Split by file size option for Multi-File recordings.
Order analysis – New calculation option: Amplitude Type
The Order Analysis feature includes a new configuration option: Amplitude Type. This allows you to define the resulting amplitude values. You can choose between:
- Amplitude RMS (previous and current default setting)
- Amplitude
- Amplitude P2P (Peak-to-Peak)
Modbus – Max. Polling rate increased
In previous OXYGEN versions, the maximum polling rate of our MODBUS TCP plugin was limited to 10 Hz. As of this update, we have increased the maximum polling rate to 100 Hz.
CAN(-FD) – Updated .ARXML File Decoding
In general, when working with CAN(-FD) data in OXYGEN, you can load DBC or ARXML files to simplify CAN configuration. With this update, ARXML file decoding has been improved — it now also supports Container PDUs and Secured PDUs, ensuring broader compatibility and enhanced data interpretation.
Export – Skip Timestamps
The export functionality for .TXT, .CSV, and .XLSX files now includes a new “Skip Timestamps” checkbox. When enabled, only the measurement values are exported — without the corresponding timestamps.
Instrument Upgrades
OXYGEN 7.7 introduces several improvements across multiple instruments, enhancing usability and visualization:
- GPS Plot – Now supports a two-sided color gradient, offering improved visual contrast compared to the previous single-gradient display.
- Recorder Cursors – When Show only statistics data is enabled, cursor values now also reference statistical data.
- Short Channel Name – All channel-based instruments now include a new property: Show short channel name. This is particularly beneficial for OYXGEN-NET systems, as it shortens the long channel identifiers by removing name extensions.
Example: AI 1/1@DEWE3-RM16_056 –> AI 1/1

Fig. 9: ① GPS Plot – two-sided color gradient; ②Recorder Cursor displays statistic values; ③ Short channel name option
Usability Enhancements
Additionally, this update brings several minor but valuable usability enhancements:
- A new search field in the Add Channel menu makes it easier to find and create specific software channels and analysis tools.
- CAN messages are now aligned with synchronous channels when exporting data at a reduced rate, ensuring consistent time correlation.
- The hardware mismatch warning when loading a TRIONet(3) setup (.dms file) on a different TRIONet(3) system that has an identical TRION(3) board configuration, is now automatically suppressed.