OXYGEN 7.6 - powerful visualization, new tools & lots of improvements

OXYGEN 7.6 brings a wide array of new features—ranging from powerful visualization tools like the all-new 3D-Plot and Time Reference Curves, to advanced plugins such as the Frequency Tracking Filter. At the same time, this release delivers meaningful enhancements to established tools, including the X/Y Plot, Power Group, and export options. In this blog post, we’ll guide you through all the updates and show you how they can make your measurement and analysis tasks easier, faster, and more insightful.
New Features
- 3D-Plot Instrument
- Time Reference Curves
- Channel Configuration Export
- Frequency Tracking Filter
- X/Y Plot Improvements
- Power Improvements
- Export Add-On‘s
- New Math Functions
- Miscellaneous Improvements
3D-Plot Instrument
OXYGEN 7.6 introduces a brand-new 3D-Plot instrument for three-dimensional data visualization. This tool is especially useful for interpreting complex results such as Order Analysis or Amplitude Spectra, but it also supports all other array-type channels—including CPB, Harmonics, and more.
The entire plot is fully interactive: you can rotate, move, and scale it directly with your mouse, allowing you to inspect your data from every angle with ease. The instrument properties offer further scaling and orientation options, along with multiple color sequence presets to adapt the visual output to your needs. For a detailed look, crosshair values are displayed in the upper-left corner of the plot. Fig. 1 shows the new 3D-Plot instrument in action, including an example of an order matrix visualization and the available configuration settings.
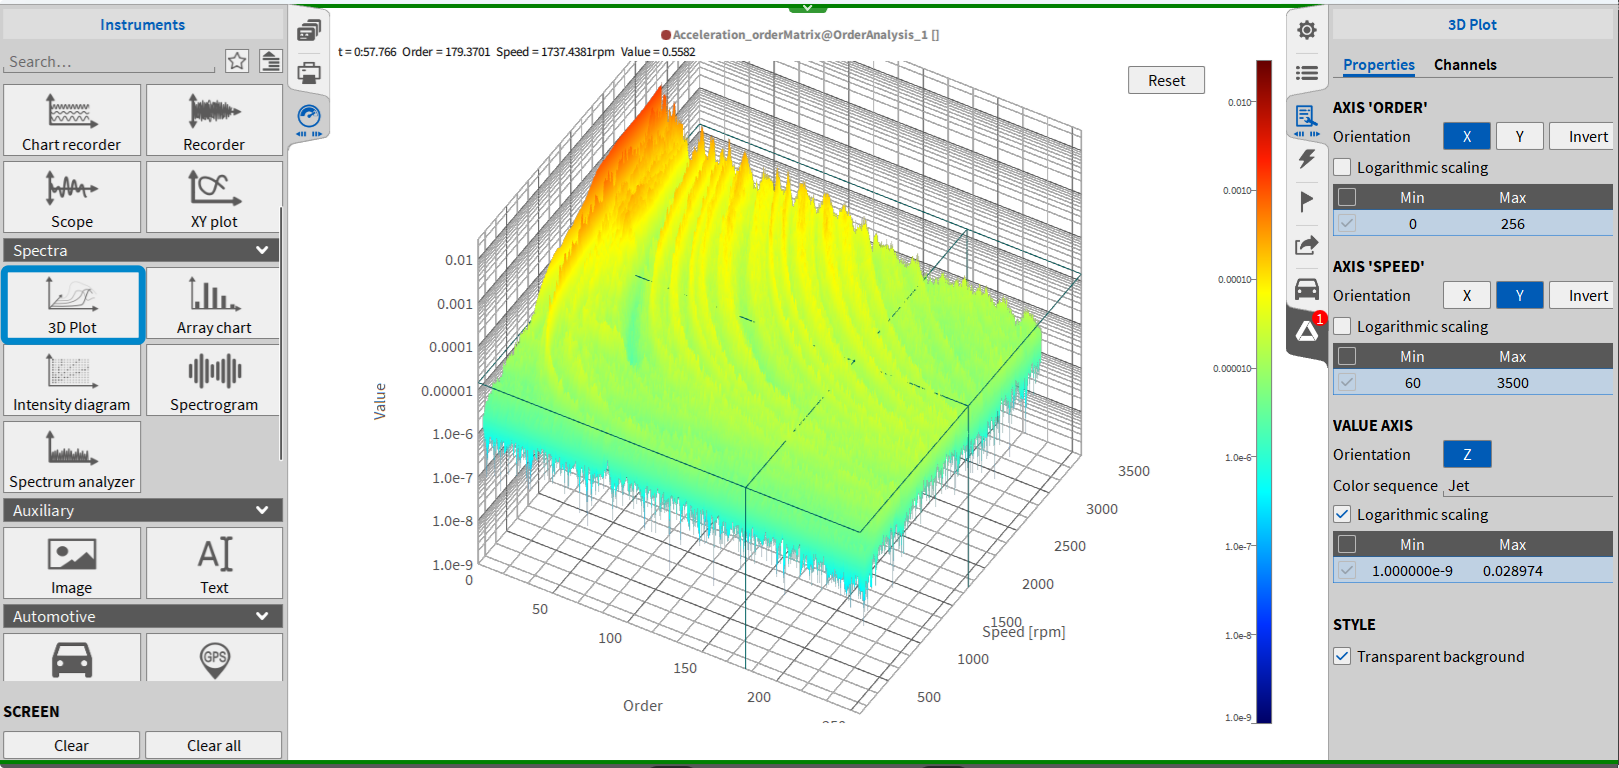
Fig. 1: New 3D Plot instrument
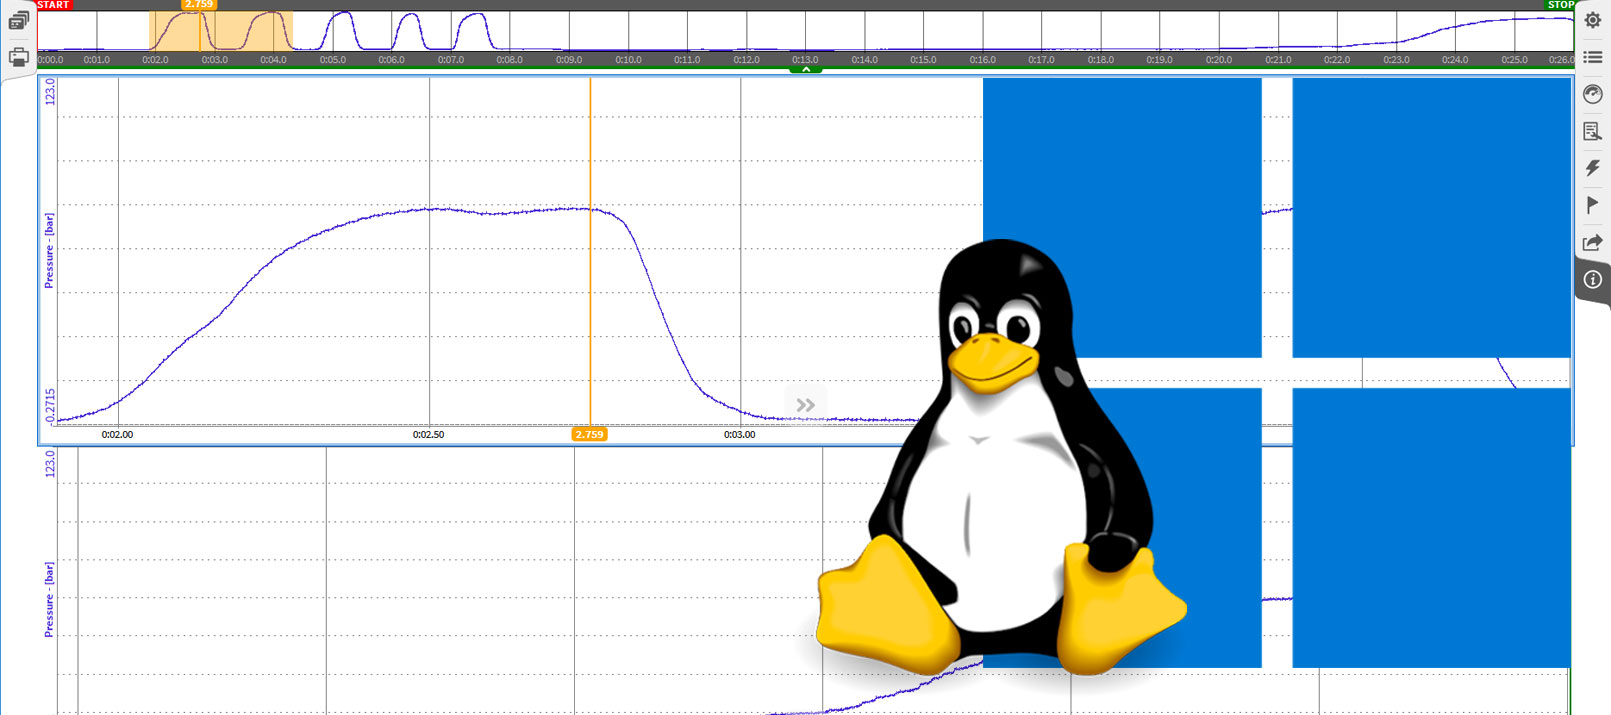
Time Reference Curves
With our new update, we’ve added the Time Reference Curves plugin—designed to display reference data alongside live signals in the time domain. You can define the reference data manually, copy it from a table (e.g., Excel), or *import it from a previously recorded .dmd file.
The plugin lets you choose between creating a single reference curve or defining upper and lower limit curves for visual boundaries. Additional configuration options include:
- Fill Ahead Time: Display reference data up to 500 seconds in advance
- Start Condition: Begin the curve on acquisition, recording, or a trigger event
- End Behavior: Choose to loop, hold the last value, or output NaN when the data ends
You’ll find the Time Reference Curves plugin in the Advanced Math section of the Add Channels menu.
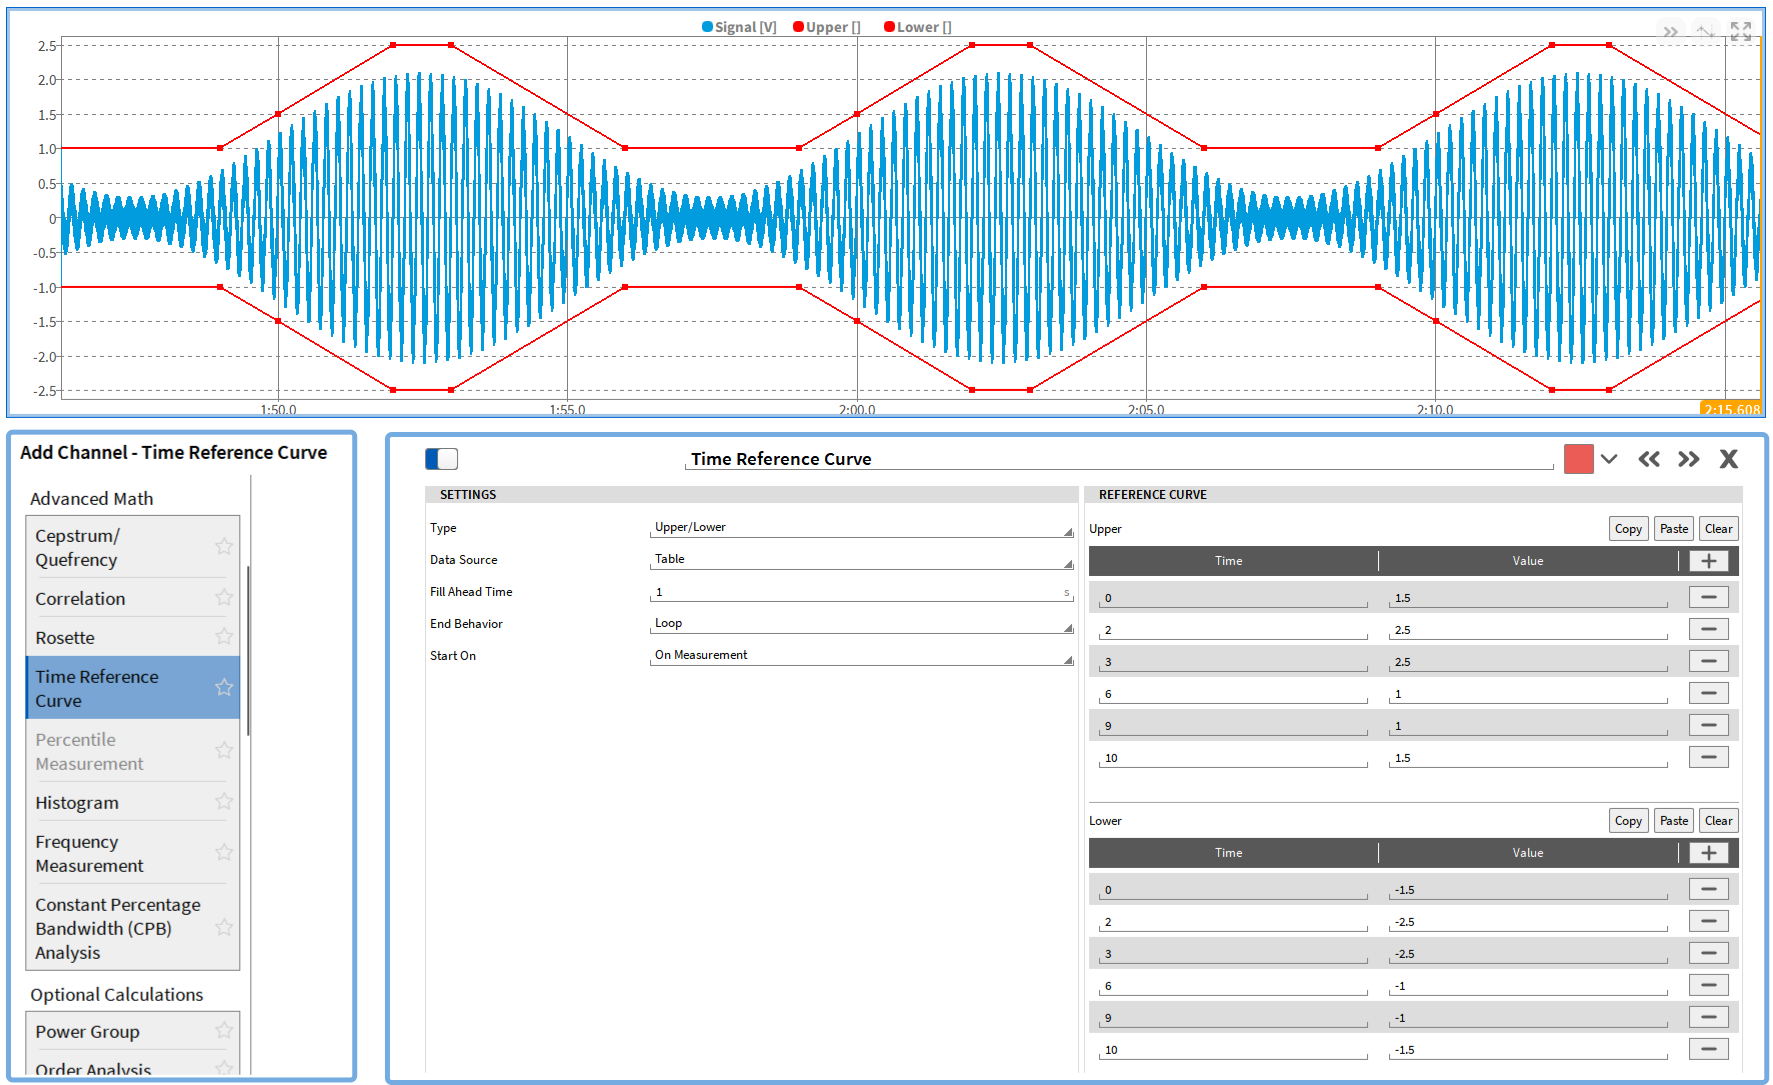
Fig. 2: Time Reference Curve plugin
Channel Configuration Export
We now offer a convenient way to export channel settings for documentation and review. With just a few clicks, you can now copy channel configurations directly to third-party software such as Excel, Notepad, or similar. To do so, simply select the checkboxes of the channels you want to export, press CTRL + C, and paste the data into your desired application. This makes it easy to document hardware channel settings.
Frequency Tracking Filter
A new addition to OXYGEN 7.6 is the Frequency Tracking Filter, a powerful tool for applications such as vibration analysis, machinery diagnostics, and order tracking. This new feature functions as a smart bandpass filter, which continuously adjusts its center frequency based on a reference speed signal. The center frequency is calculated as a (non-)integer multiple of the reference speed (in Hz), allowing the filter to follow specific orders and suppress all unrelated frequency components. You can assign multiple input channels and define one or more orders to track. For each defined order for each input channel, one output channel is created. Additional filter settings include: Filter Type, Filter Order, and Filter Bandwidth. You can find the Frequency Tracking Filter in the Filters section of the Add Channels menu.
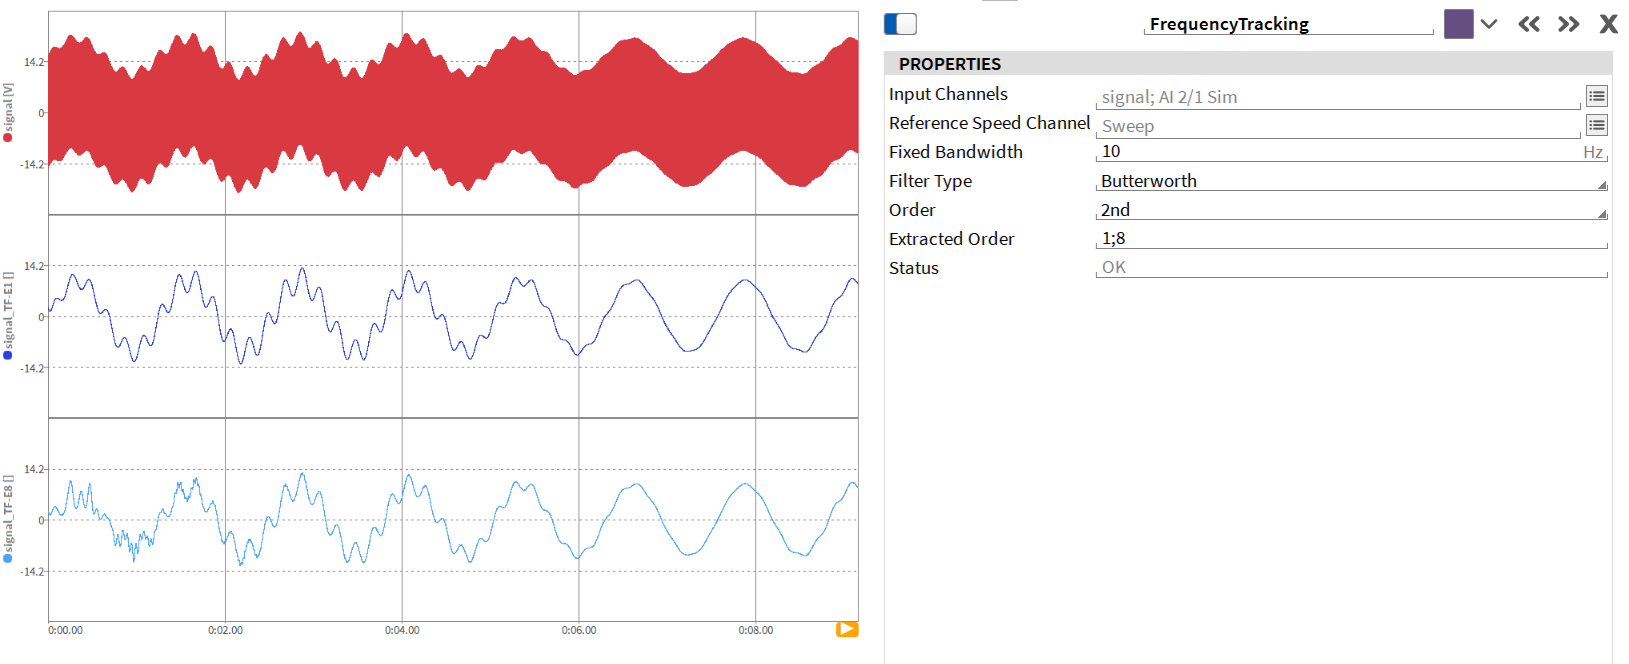
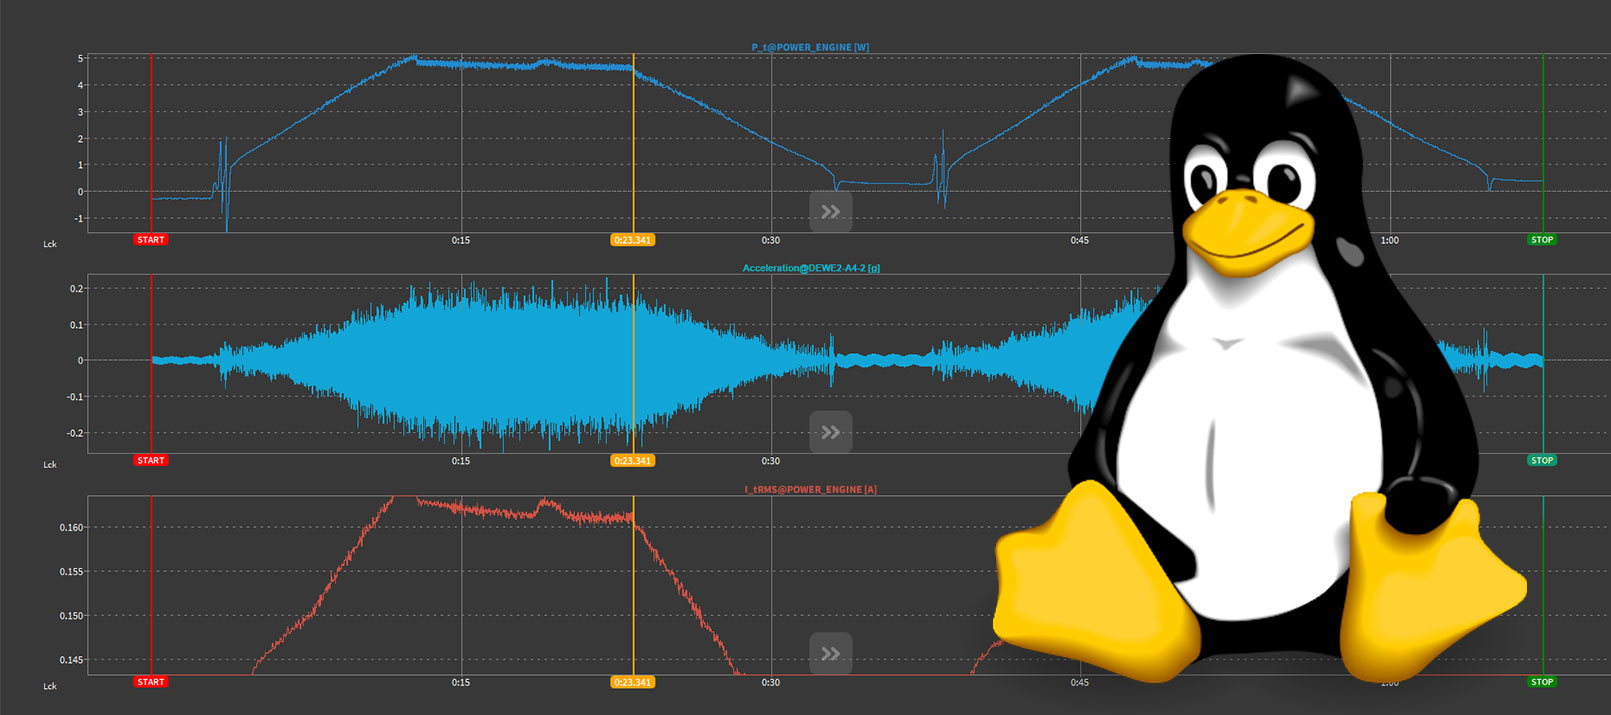
Fig. 3: Frequency Tracking Filter plugin
Fig. 3 illustrates the Frequency Tracking Filter settings and its functionality in a practical example. The red curve shows the original (unfiltered) signal, while the dark blue trace represents the filtered output for the 1st order, and the light blue trace corresponds to the 2nd order.
X/Y Plot Improvements
The X/Y Plot instrument receives several valuable upgrades in OXYGEN 7.6, making it more versatile and flexible. The most notable enhancement is the ability to create multiple reference curves directly within the instrument. Note that these curves simply act as visual boundaries. To add one, click the + button in the Reference Curves section, then select Edit to enter your X and Y coordinates. Points are connected using linear interpolation, providing a clear and intuitive reference line on your plot.
Additional improvements include:
- Pinned data labels, similar to the Recorder instruments, are now supported
- Customizable label formatting, including font size and value precision
- Crosshair values are now shown in the upper-left corner for quick reference
- A/B cursors can be added to measure delta values directly in the plot
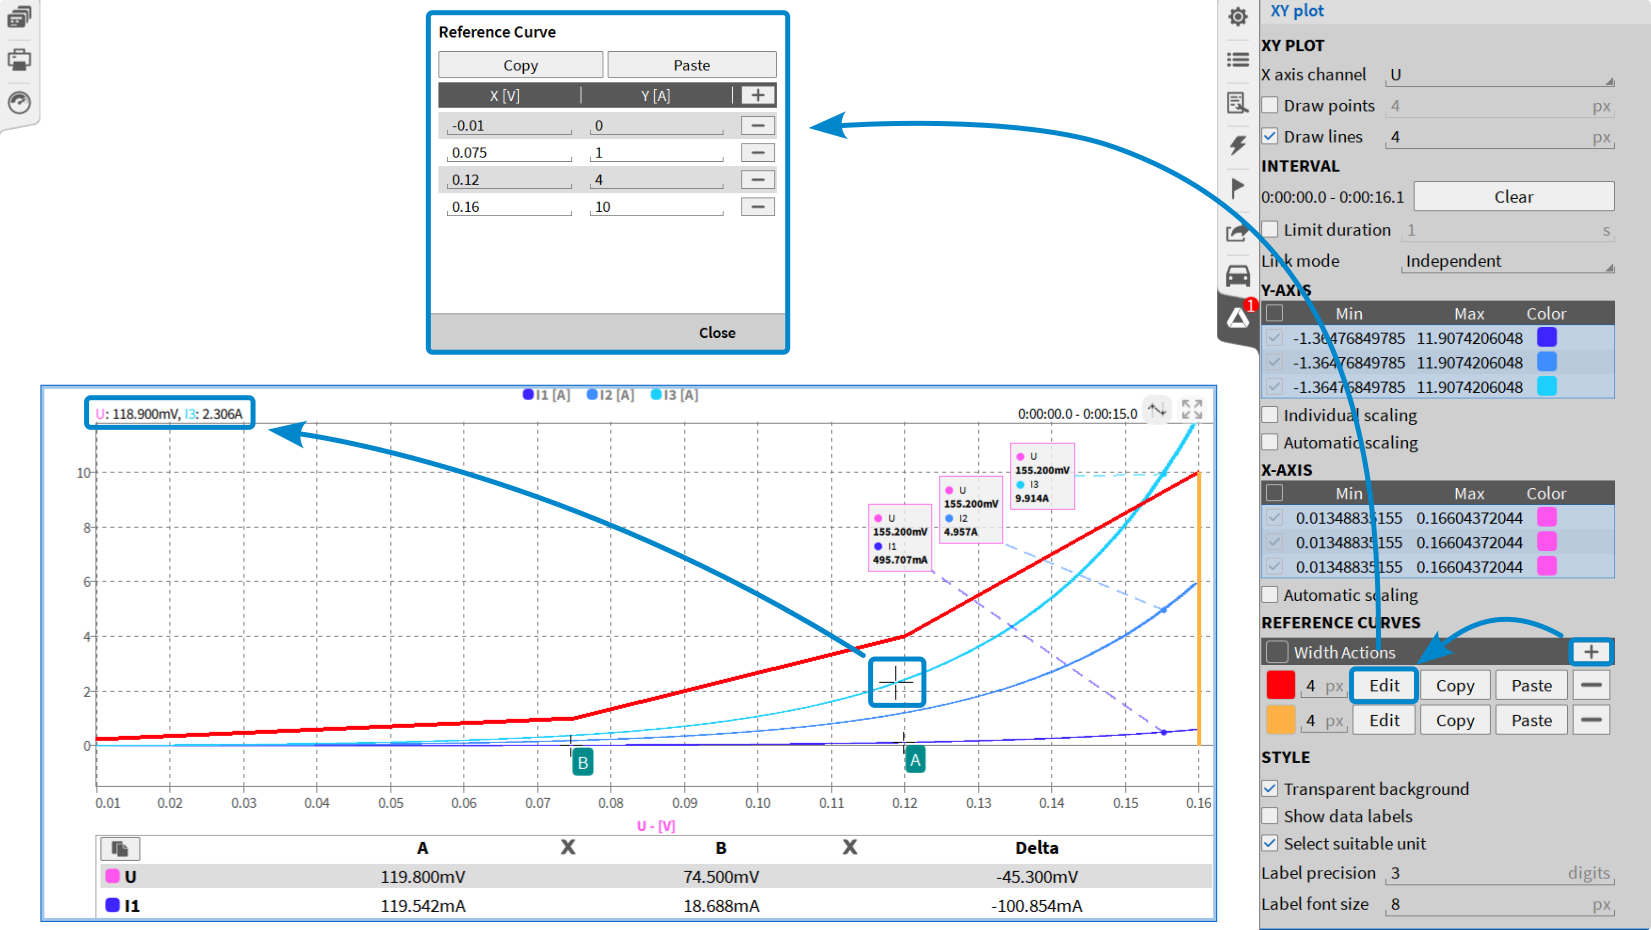
Fig. 4: XY Plot – new features
Power Improvements
This update brings a set of practical enhancements to the Power Group, adding more insight and flexibility for energy and electrical system testing.
- Addition of Harmonics Limits Table
A new feature to monitor and visualize violations of harmonic components during measurement. You can define absolute thresholds for voltage, current, and active power harmonics & interharmonics. These limits can be displayed in a dedicated column for easy comparison. In case a threshold is exceeded, the respective harmonic line is highlighted in red. In addition, you can show the max RMS level for a definable time in a separate column.
Note: This requires the software option OXY-OPT-POWER-ADV.
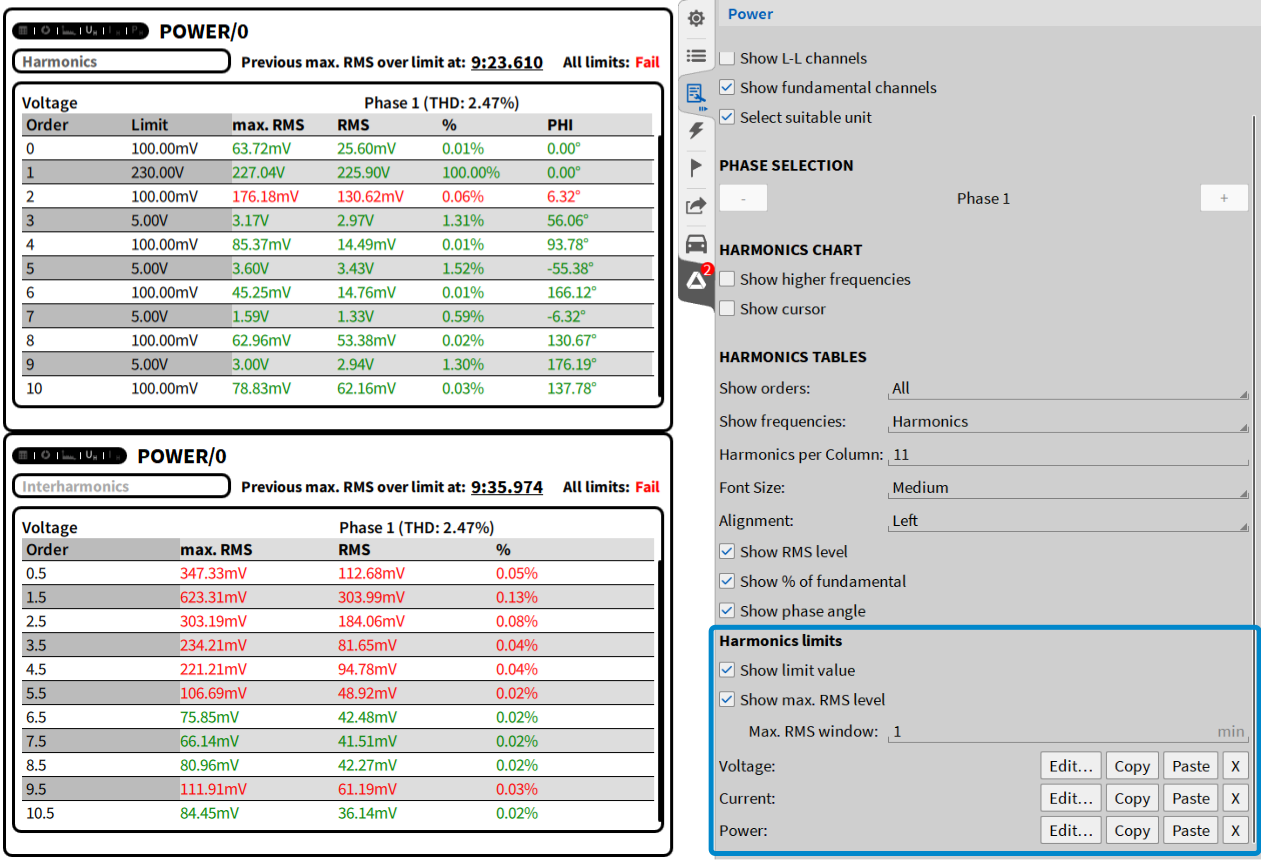
Fig. 5: Limits for harmonics table
- Additional „Symmetrical Components“ channels for Voltage, Current & Apparent Power
To support the latest standards, OXYGEN now offers additional channels for analyzing symmetrical components of voltage, current, and apparent power. These parameters comply with FGW-TR3 Rev. 26 and include analyses such as phase angle, vector components, and apparent power. This functionality is included in OXY-OPT-POWER-BASICS. The same analyses are also available as part of Rolling Computations through OXY-OPT-POWER-EXP.
- Resolver Plugin – Support for Multiple Pole Pairs
The Resolver Plugin now supports resolver sensors with multiple pole pairs. Previously, only single-pole-pair resolvers were supported. Configure the number of pole pairs in the channel configuration of
Note: This extension is part of the OXY-OPT-TAPE-RES option.
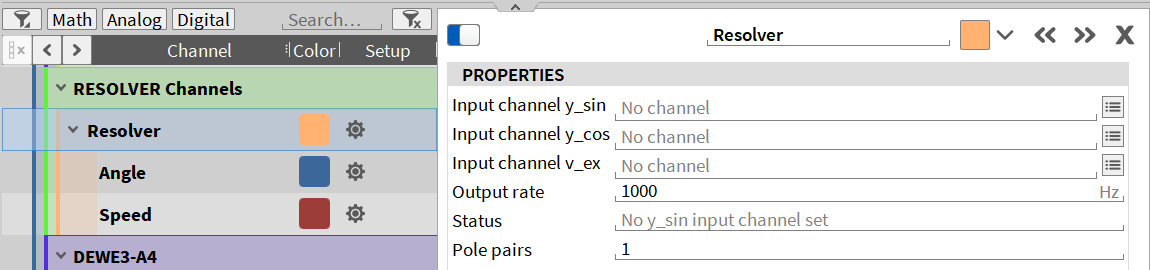
Fig. 6: Resolver channel configuration – new setting option for pole pairs
Export Add-On‘s
We added two convenient improvements to our export options:
- When exporting to MATLAB, the scaling information is now directly included in the generated *.mat file.
- For Excel exports, the new option Header fields allows you to export header information in a separate spreadsheet tab.
New Math Functions
OXYGEN 7.6 extends its math capabilities with a set of new formula functions for signal generation, simulation, and custom processing. These functions are ideal for creating synthetic waveforms, modeling input signals, or testing system behavior under specific conditions. The new additions:
- chirp(f0, f1, d) generates a sine sweep from frequency f₀ to f₁ over a duration d.
- sinwave(f, [φ]), coswave(f, [φ]), sawwave(f, [φ]), and triwave(f, [φ]) create standard periodic signals (sine, cosine, sawtooth, and triangle) with optional phase shift φ.
- pulsewave(f, d, [φ]) produces a pulse waveform with frequency f, duration d, and optional start phase.
- delay(value, N, [y₀]) shifts/delays a signal by N samples, optionally initializing the delayed output with y₀.
- lerp(a, b, t) performs linear interpolation between a and b using the factor t, based on the formula (1–t)·a + t·b.
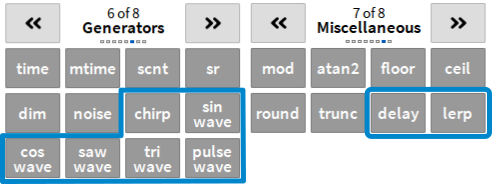
Fig. 7: Added functions for formulas
Miscellaneous Improvements
Alongside the major features, a series of smaller enhancements have been added to make your workflow smoother, the interface more intuitive, and the software overall more powerful.
① Colored background for Digital Meter
You can now customize the background color of the Digital Meter—including default, upper limit, and lower limit backgrounds. Just make sure to disable the transparent background option when applying custom colors
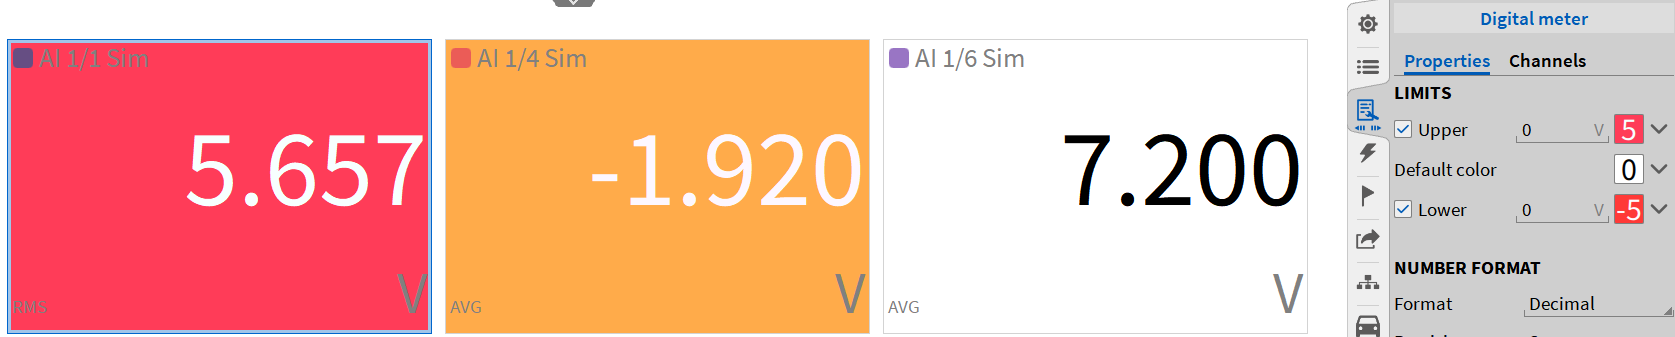
Fig. 8: Colored background for Digital Meter
② Increased sample rate divider
The maximum division ratio has been raised from 1,000 to 10,000, offering greater flexibility for signal downsampling.
③ ARINC decoder update
ID values can now be interpreted as octal, in addition to the previously supported decimal format.
④ Improved synchronization support
Exact IRIG code specification is now available in both SYNC IN and SYNC OUT menus. Support for PTP domain configuration has been added to SYNC IN (Default domain 0 supported).
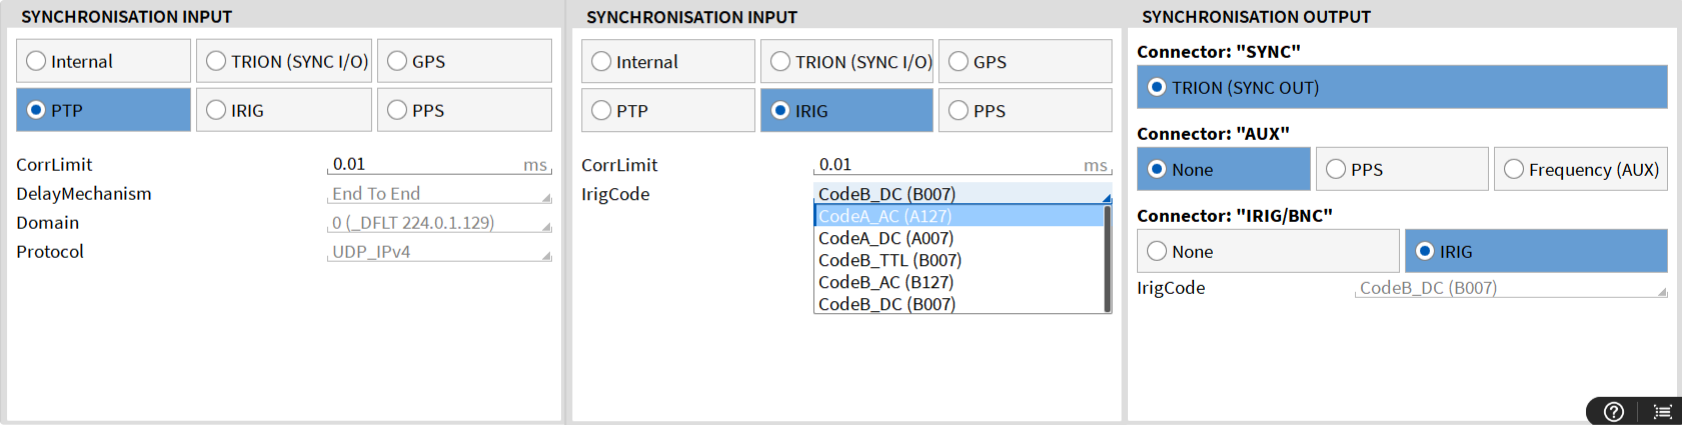
Fig. 9: Detailed description of IRIG code and PTP domain
⑤ DataStream Extension
You can now trigger the start of data stream transfer using an absolute timestamp via SCPI command, e.g., :DST:STARTTIME “01-01-2026 12.00.00”.
⑥ FFT improvements
We added the option to apply frequency weighting to Math FFT and Spectrum Analyzer FFT. Choose between A, B, C, D, or Z weighting, either in the channel settings for Math FFT or in the instrument properties of the Spectrum Analyzer.
⑦ FIR filter usability
The output sample rate of FIR filters is now displayed directly in the filter setup in the FIR STAGES section.
⑧ Deletion warning
A prompt now appears before deleting Math channels, helping prevent accidental channel deletion.
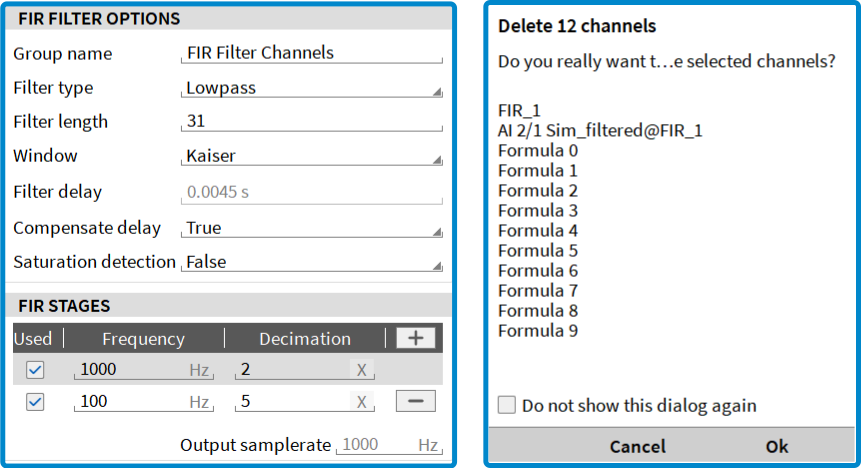
Fig. 10: Left: Output samplerate in FIR settings; right: Warning when deleting channels
⑨ Input mode switching adaptations
When changing from input modes “Voltage”, “Current”, “Bridge”, or “Potentiometer” to “Excitation Voltage Monitor” or “Excitation Current Monitor”, the excitation settings are preserved instead of being reset to defaults.