10 questions about OXYGEN
If you already know DEWETRON, then you are most likely also familiar with our data acquisition software OXYGEN. Our measurement software is the most intuitive software in the field of data acquisition and can be operated via touch screen or classically with mouse and keyboard. Although it is very easy to use, OXYGEN is a very powerful tool with many different features.
For this blog post, we have collected 10 basic questions about our measurement software. Whether OXYGEN is new to you, or you are already using it, the answers to these questions will give you valuable insight into the features and the software itself.
We will discuss the following:
- Does OXYGEN require a software license?
- How do I get the latest update?
- Are there different OXYGEN bundles?
- Which operating system is required?
- What is the DEWETRON Explorer?
- How to visualize data in OXYGEN?
- Can I review data during recording?
- How can I create measurement reports?
- Can I add my own features/plugins?
- What kind of post processing is possible with OXYGEN?
1. Does OXYGEN require a software license?
This depends on the application of the software. There is no requirement for a software license for reviewing recorded data and for post-processing. However, for recording data a license is required.
In case you acquire a license, this license is only purchased once. There are no mandatory regular payments. In addition, a license includes all minor updates for the purchased major version of OXYGEN. Example: The purchase of OXYGEN 6 includes all 6.x updates. However, the upgrade to the next major version (7.x) must be purchased individually.
For those who want to be up to date all the time, we offer the “OXYGEN Lifetime Option”. This includes free updates to the latest version (including major versions) for the lifetime of your chassis.
2. How do I get the latest update?
The latest version of OXYGEN can be found on our Customer Care Center (CCC). There you also can find the software manual which provides information about the latest improvements and specifications. Further, the CCC offers videos, demo data, and more.
License note: With the purchase of an OXYGEN license, you have access to all minor software upgrades and updates for your acquired version (e.g. OXYGEN 6.0 to 6.x ). Upgrading to a new major version (e.g. OXYGEN 6.0 to 7.0) is with costs.
3. Are there different OXYGEN bundles?
In a way, yes!
In general, we offer a basic OXYGEN version, for data acquisition and data processing. This includes for instance functionalities like synchronization, filtering, FFT, calculation of specific parameters, frequency measurements, and many more. In addition, we offer optional features optimized for specific applications and lines of work. By adding these features to your basic version, you can create your own individual OXYGEN bundle.
Note: All optional features must be purchased separatel
4. Which operating system is required?
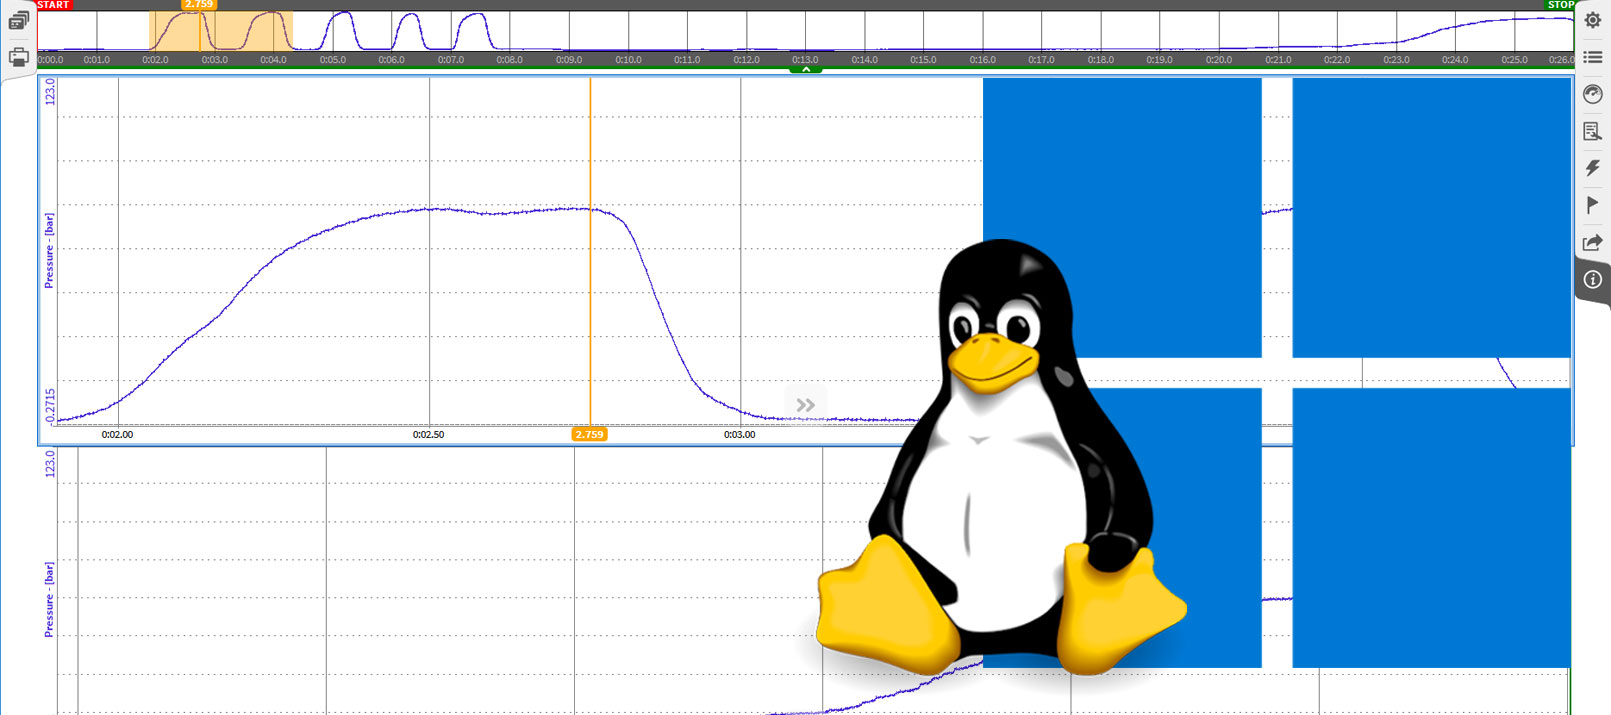
Fundamentally, OXYGEN is a Windows-based software meaning it was originally designed for a Windows environment. Thus, it is manageable like any other Windows software. However, since update 6.2 it also runs without restrictions on a Linux operating system. More precisely, OXYGEN supports the distributions Red Hat Enterprise Linux 8 (RHEL8) and Ubuntu 20.04 LTS.
Measurement setups and DMD measurement data are fully compatible between the different operating systems. For example, you can import already created setups from one system to the other.
Find out more about which operating systems are supported by OXYGEN.
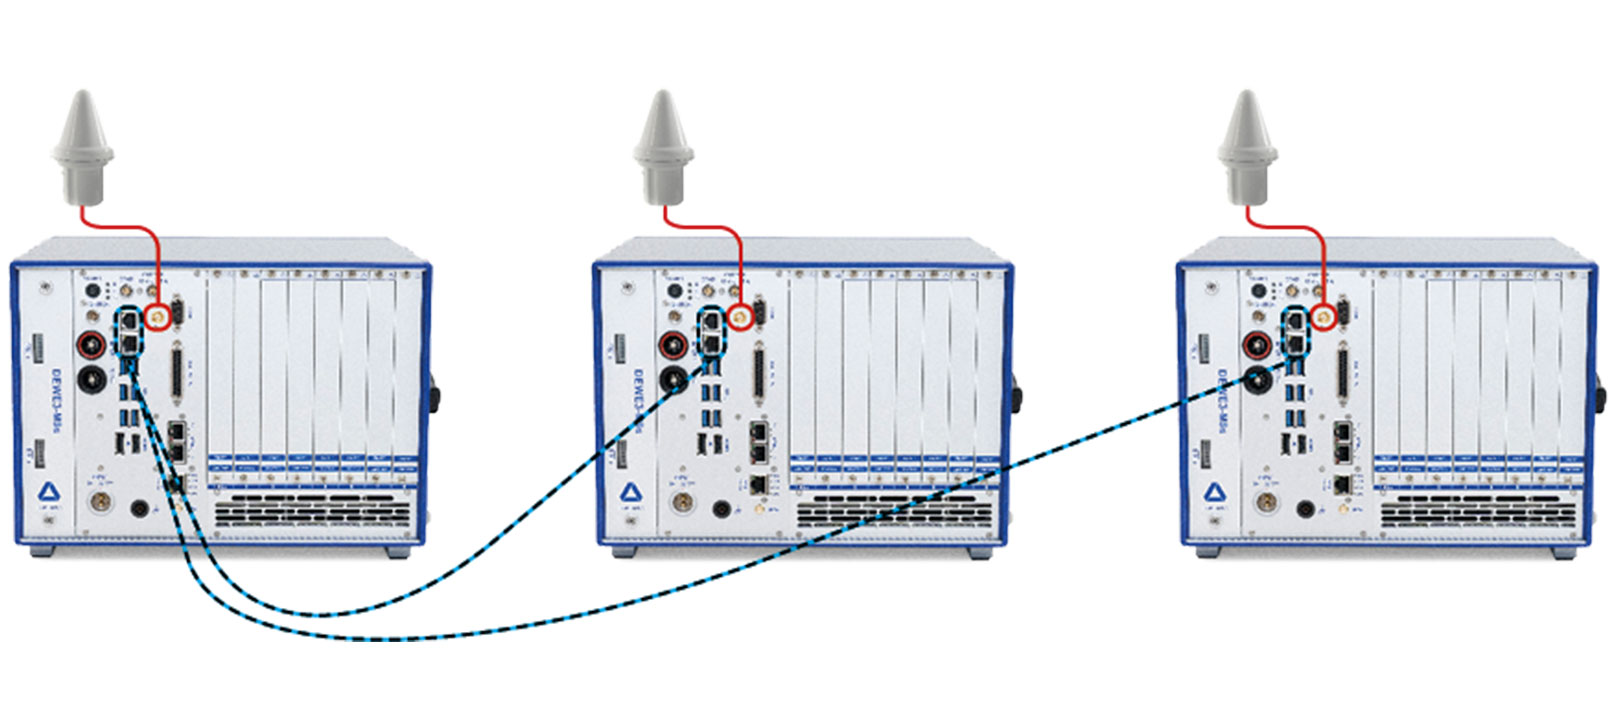
5. What is the DEWETRON Explorer?
The DEWETRON Explorer is an individual software and serves two main purposes. Firstly, it acts as a kind of hardware overview and firmware updater for all DEWETRON devices. It enables automatic recognition of the devices connected to the PC. Secondly, it allows the simulation of measurement data via a “demo system”. In a sense, it creates a virtual measuring device with which desired measurements can be simulated. In the following video, we show how to create a demo system step-by-step.
You are currently viewing a placeholder content from YouTube. To access the actual content, click the button below. Please note that doing so will share data with third-party providers.
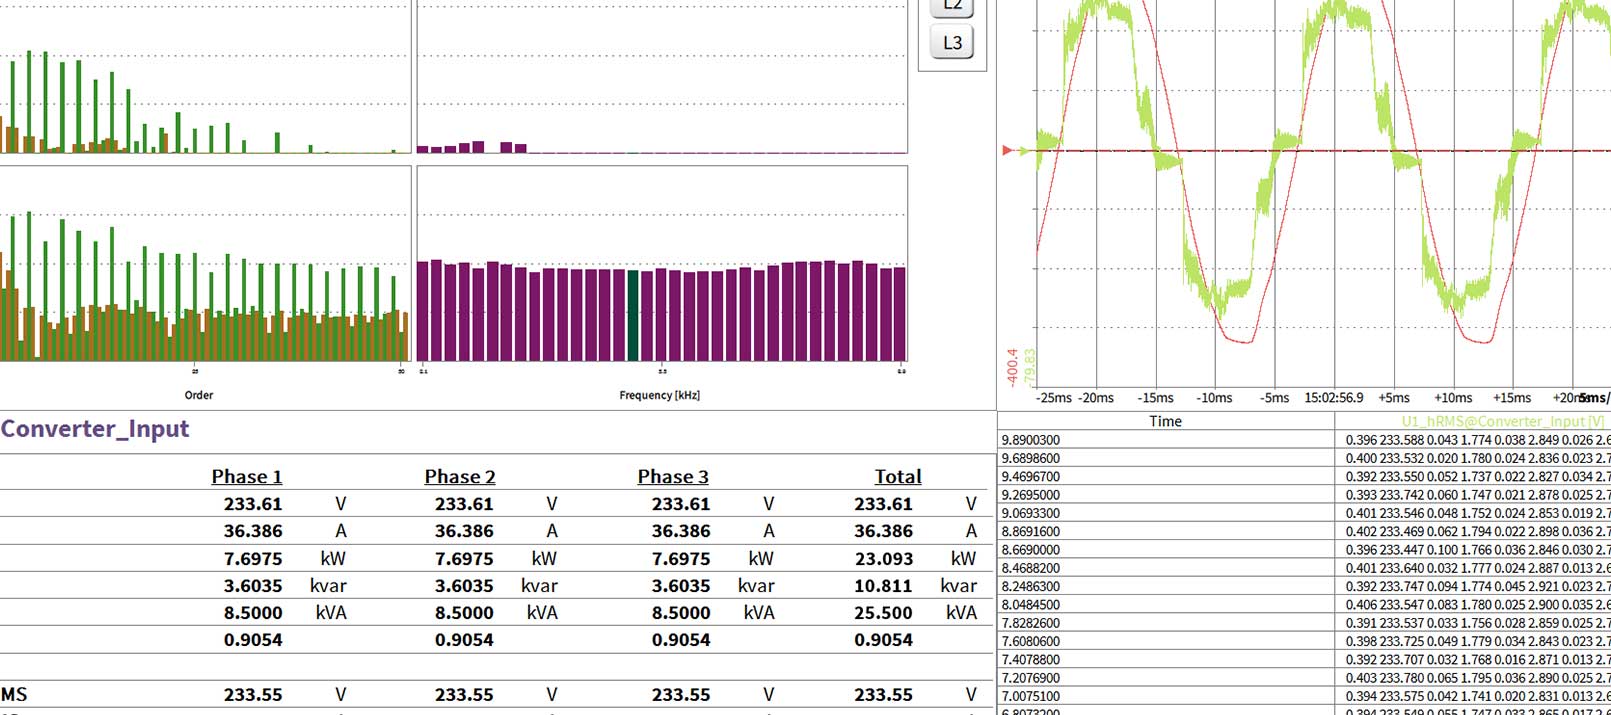
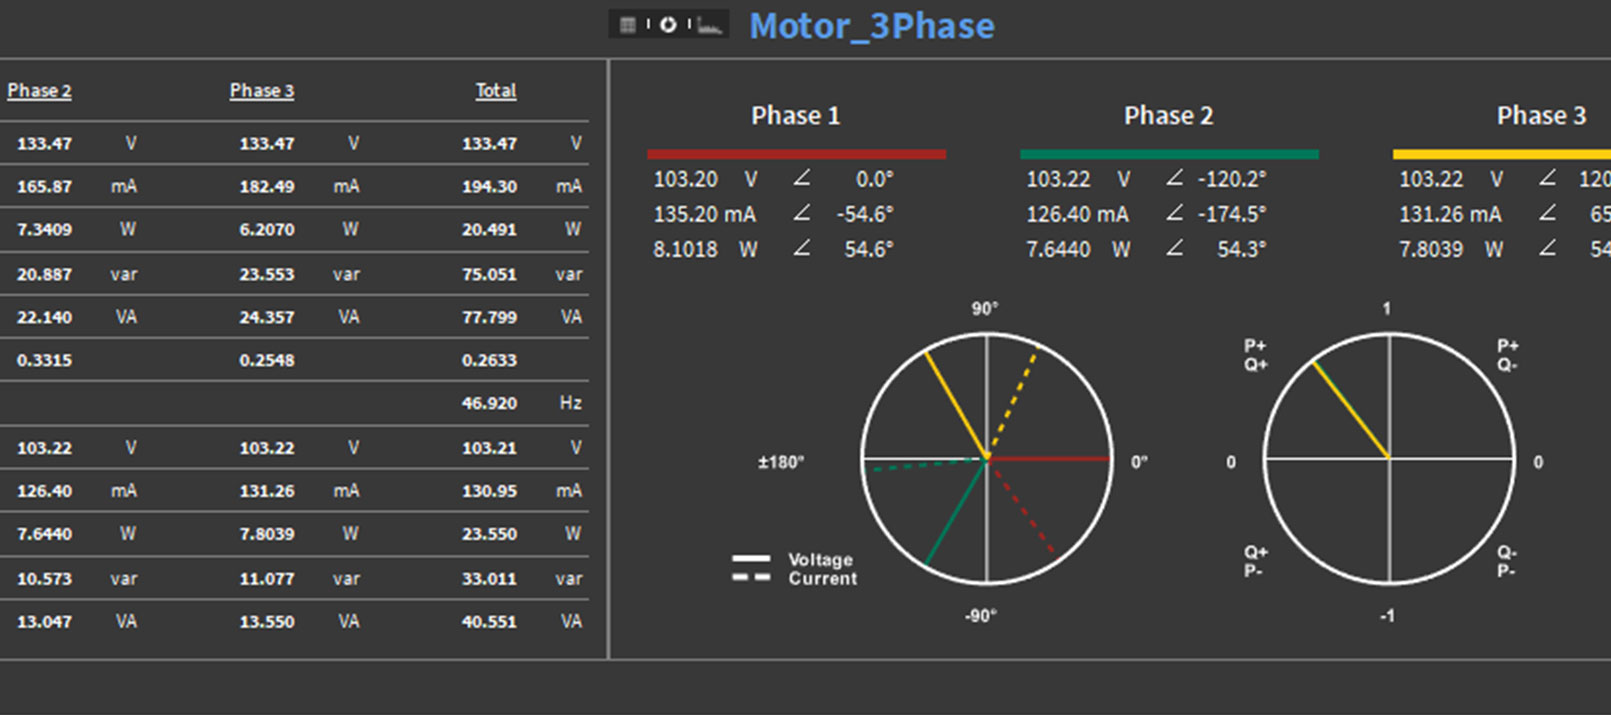
6. How to visualize data in OXYGEN?
Data visualization in OXYGEN is simple and straightforward. Instead of searching for the needed parameters out of a bunch of values, display the parameters and channels you need using your desired visualization instruments. They are easy to configure, resizable, and can be arranged as desired via drag & drop. Freely design your screen optimized for your measurements.
For complex measurements, often lots of different parameters are required, which may not all fit on one screen. However, this is no problem as with our measurement software, it is easy to duplicate a measurement screen or add a new one.
Finally, each single screen setup can be saved and used as a template. In combination with the DEWETRON Explorer, it is therefore further possible to prepare your measurement screen(s) before measuring start.
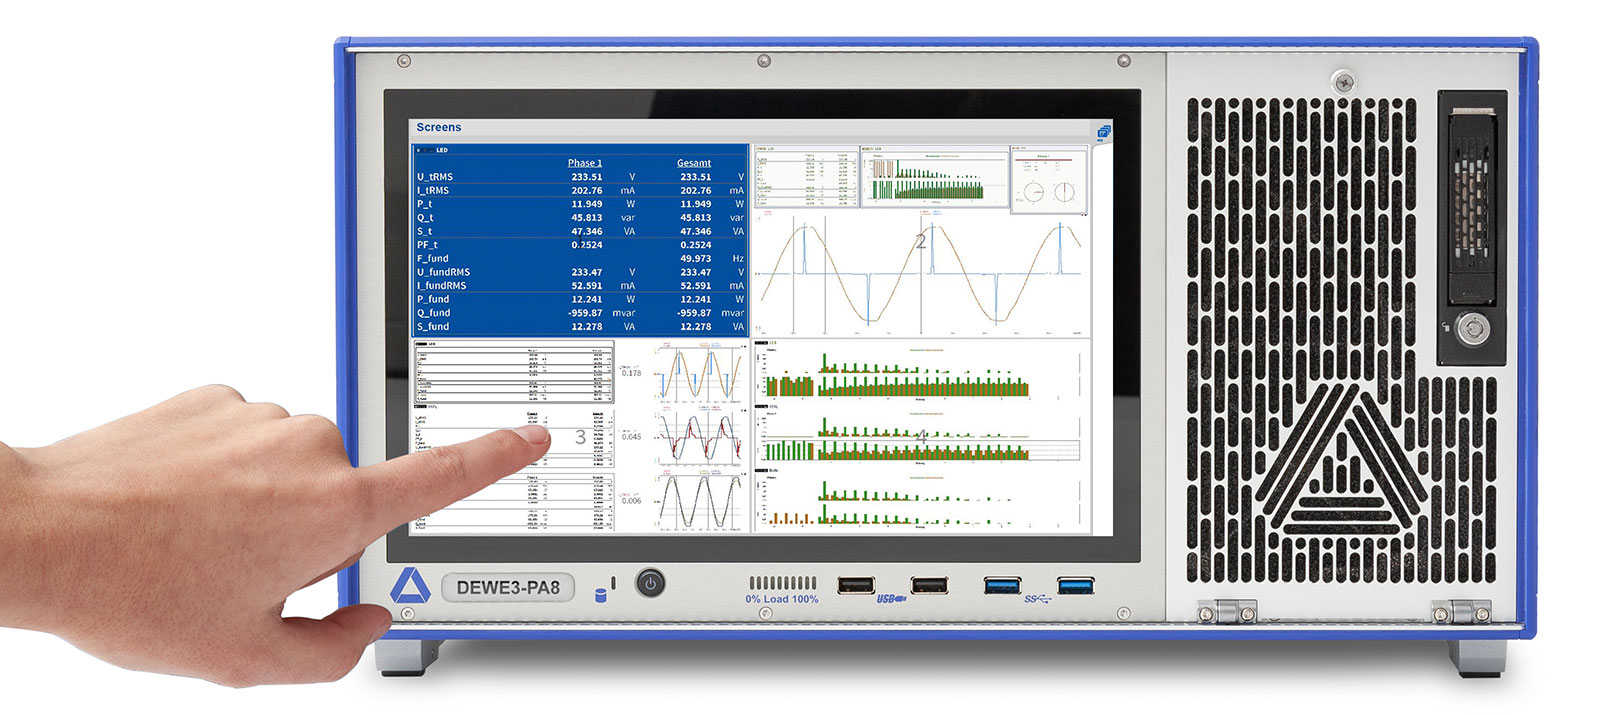
7. Can I review data during recording?
Yes, you can. The software feature “DejaView” allows you to review and analyze data even during recording. This is especially useful for long-term recordings. You can check your current measurements without having to interrupt the recording.
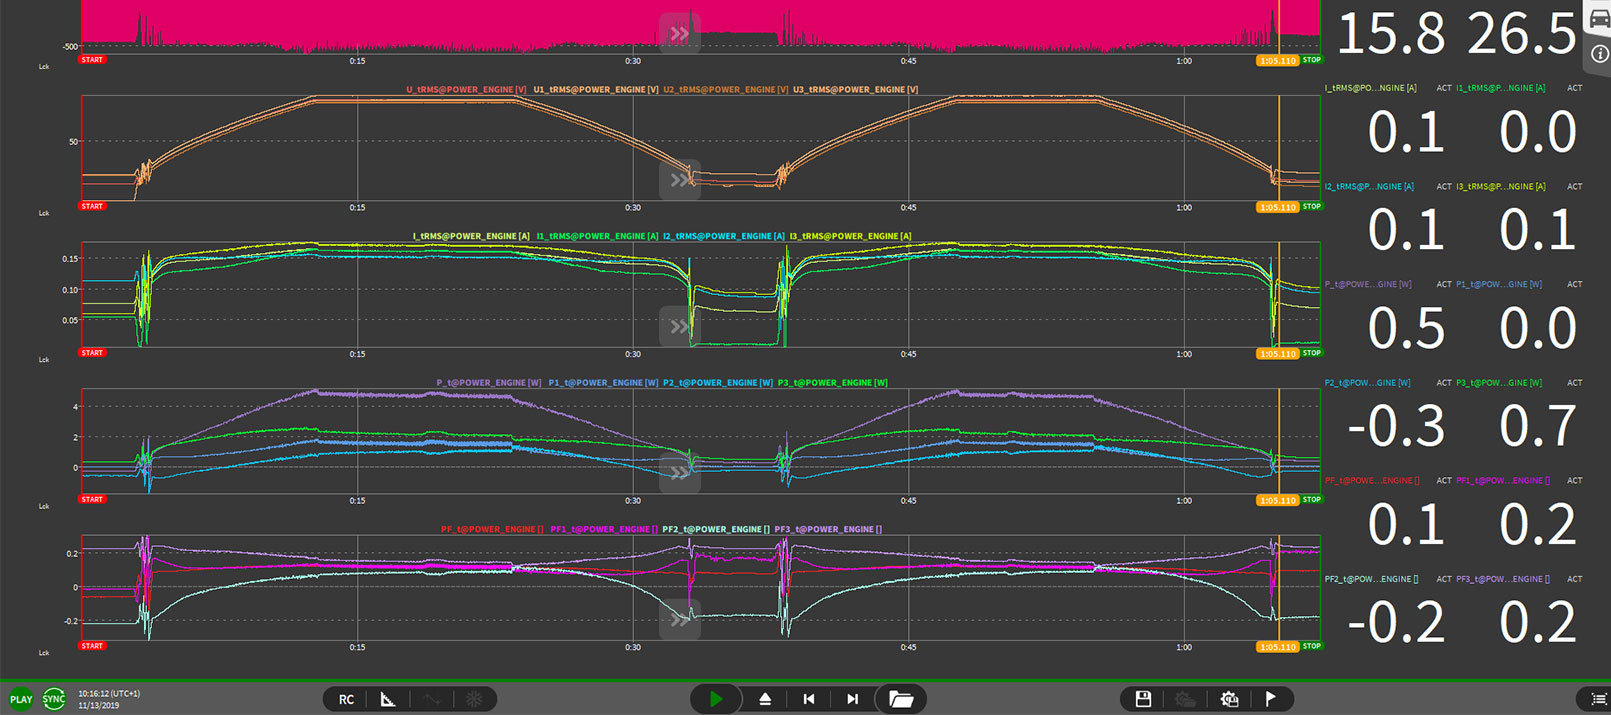
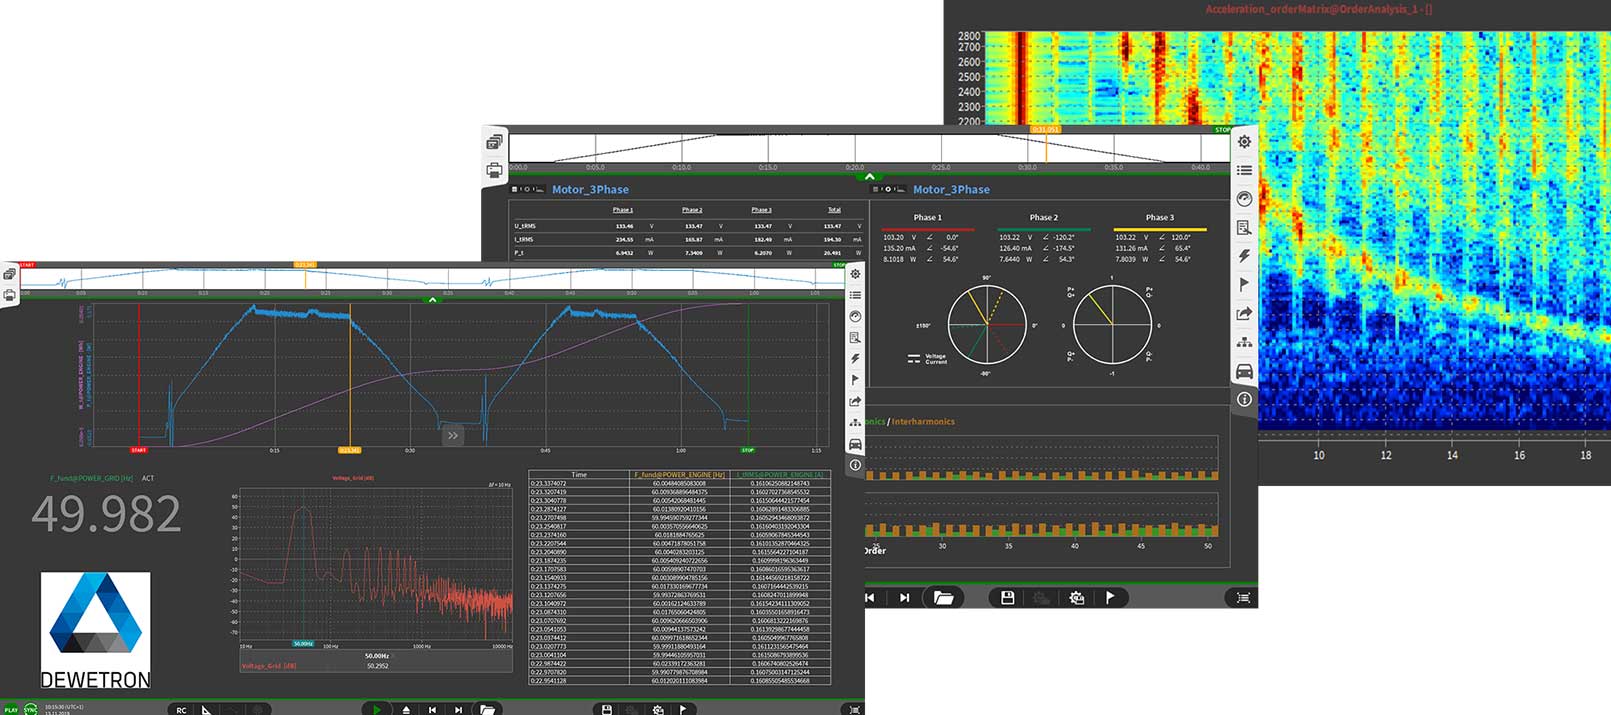
Moreover, you can also review and analyze previous data sets by means of the “OXYGEN Viewer” feature. It allows you to open and process multiple measurement files in separate windows, even during the recording of a different data set.

Figure 1: Customised measurement screen displayed using OXYGEN Viewer. The red dotted circle in the upper left corner highlights the “Reports” icon.
8. How can I create measurement reports?
You can create a report of your measurements with view simple clicks. First, click the “Reporting” icon in the left upper corner of your screen. An empty sheet appears. Simply add your instruments and parameters via drag & drop to create a report as already explained for the measurement screen. Alternatively, clone your measurement screen and add it to your report. As a final touch, adjust the footer e.g. with your company logo, and save or print the report. Note that you can create your reports during and after recording.
9. Can I add my own features/plugins?
Yes, with the OXYGEN SDK feature it is possible to create your own features, tools, plugins, etc. In case our software does not cover all your needs, you can create customized functions on your own.
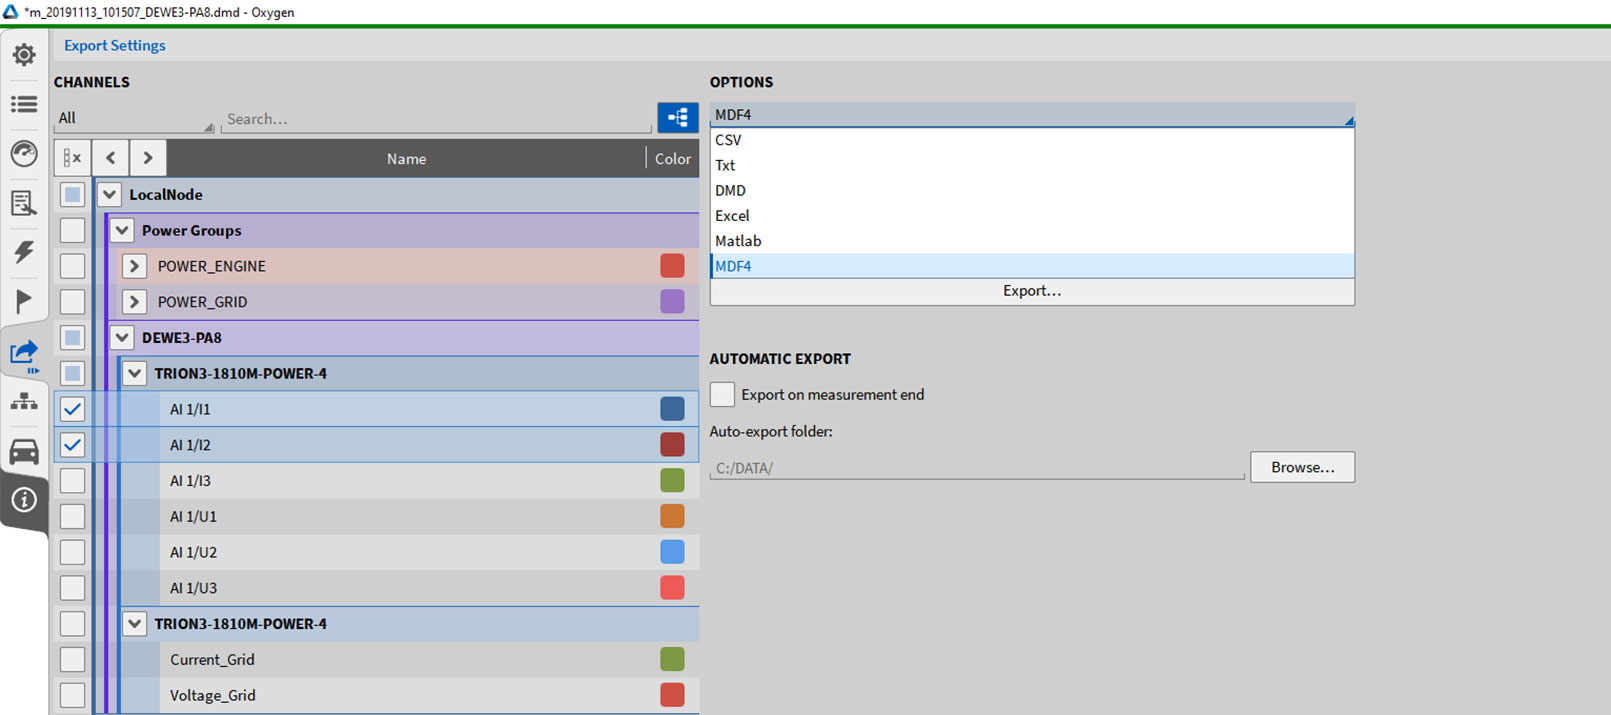
10. What kind of post processing is possible with OXYGEN?
The short answer is quite a lot!
To begin with, you can apply a variety of mathematical operations. This includes simple ones like the four basic arithmetic operations (addition, subtraction, multiplication, and division), but ranges to more advanced calculations (e.g. trigonometric and logical functions). Further implemented processing tools are CPB (Constant Percentage Bandwidth) analysis and FTT (Fast Fourier Transformation) analysis.
Optional there are line of work specific tools like:
- Swept Sine Analysis (optional)
- Order Analysis (optional)
- Sound Level (optional)
- Power Analysis (optional)
- and many more
For a list of all available tools and additional features see our OXYGEN feature overview.