Order analysis with OXYGEN
In the world of rotating machinery, vibrations tell a silent but powerful story – especially when studied via order analysis. It gives engineers a variety of insights into the examined system based on vibration and rotation measurements. Let’s dive into the fundamentals of order analysis and discover its central role in maintaining the health and reliability of machinery.
What is order analysis?
In the context of rotor dynamics, order analysis (or order tracking) is the analysis of the noise or vibrations of rotating machinery or vibrating components. It is based on vibration and velocity measurements, which require at least one acceleration sensor to evaluate the vibration of the device under test (DUT). Additionally, the determined or estimated speed and angular position of the rotor are necessary. This is usually done with encoders or tachometers.
In contrast to frequency analysis, the energy content of the noise or vibration is not plotted against the frequency, but against the order. In this context, order refers to the harmonic components of vibration signals. Each order corresponds to a multiple of the fundamental rotational speed of the rotor. In other words, this means the first order corresponds to the rotational speed of the rotor itself, the second order to twice the rotational speed, and so on. Each order represents a harmonic component in the vibration signal.

Fig 1: Order analysis cookbook
How does it work?
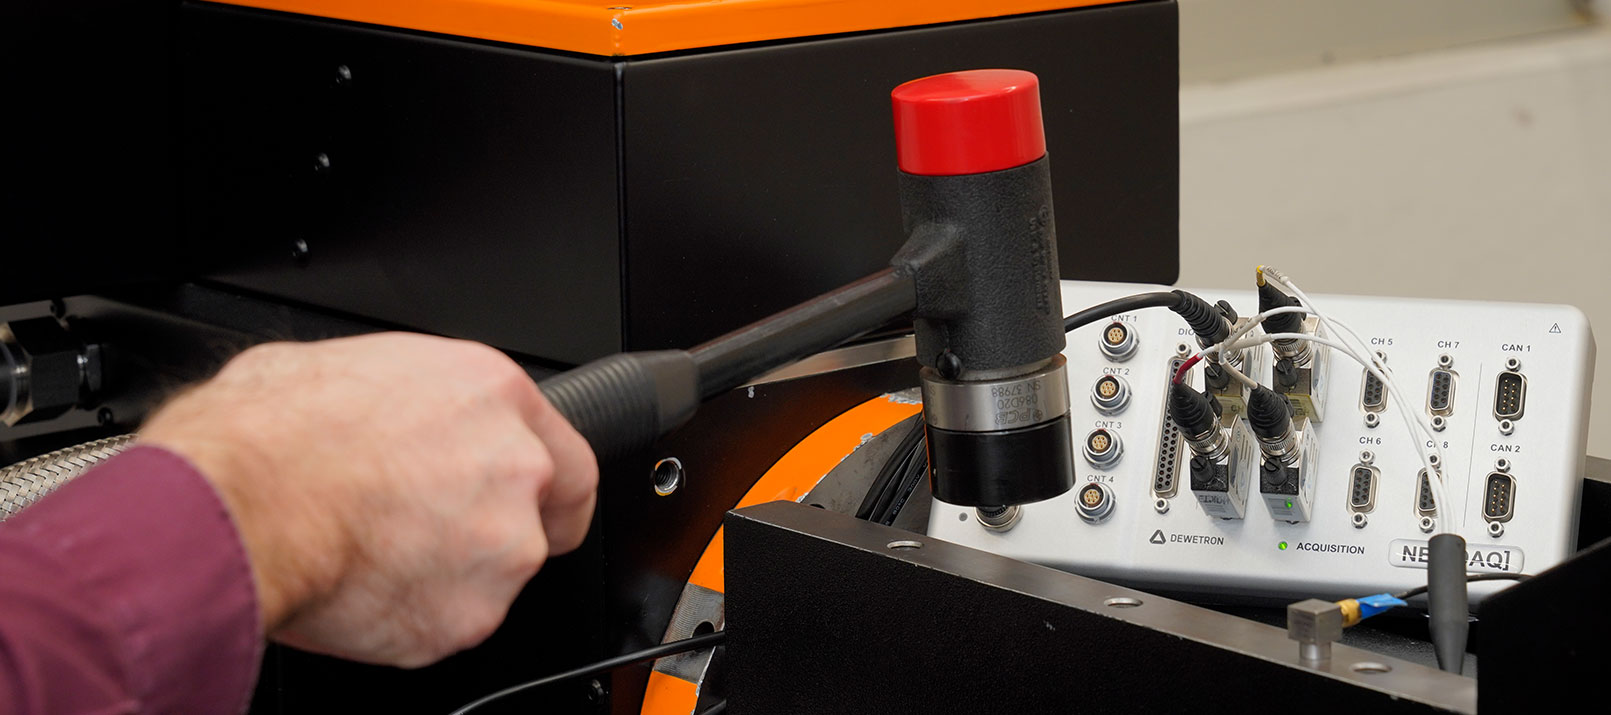
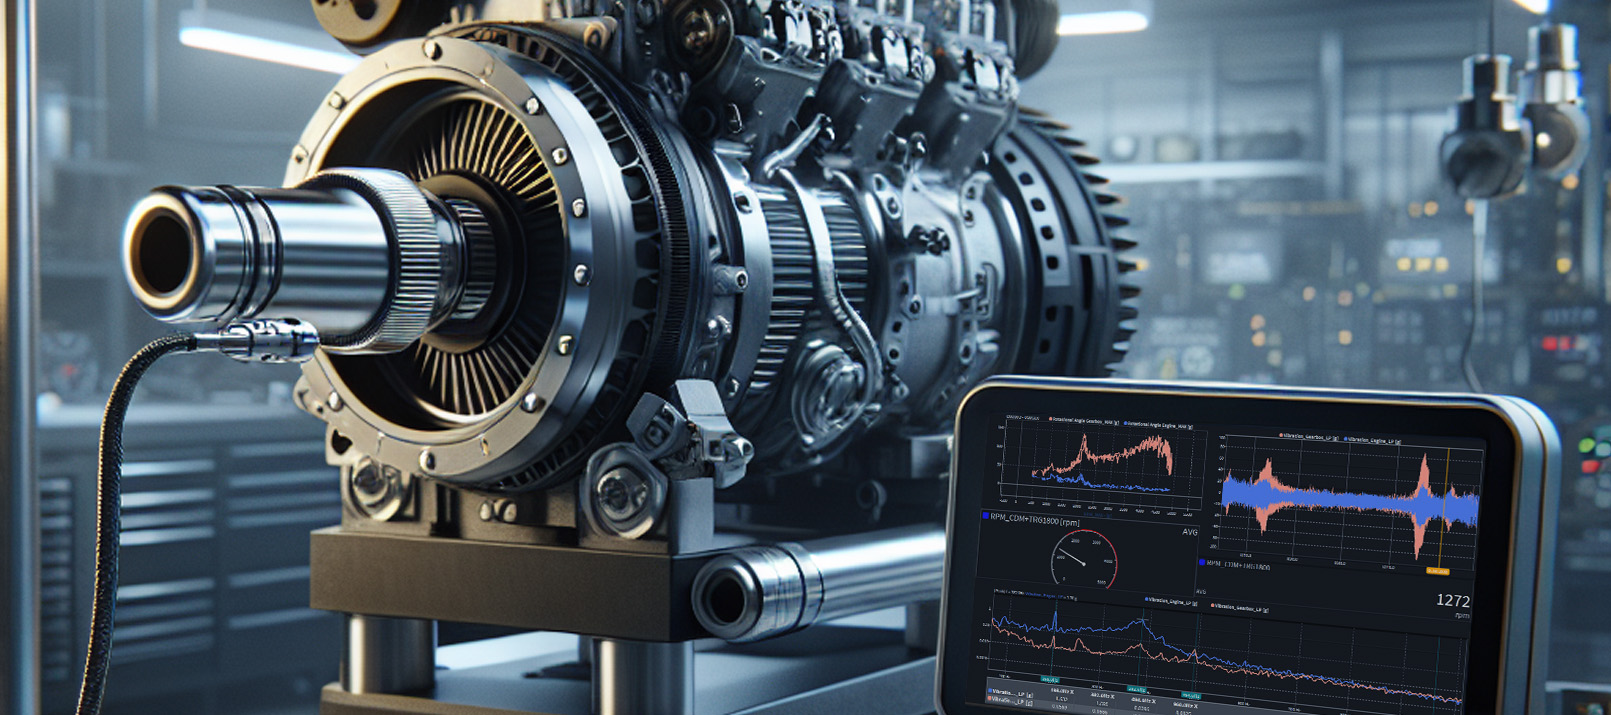
First of all, we need to collect vibration data from our DUT (e.g. engine) for instance with an accelerometer. In general, in the next step, we remove any irrelevant data (noise) from the raw vibration signal to capture only the relevant frequency range. We further need a signal that provides information about the rotational speed of the rotor of the DUT. This can be gathered with e.g. a tachometer.
Before we start the order analysis, we need to make sure our vibration data is synchronized to the rotation (or the angular position respectively) of the rotor. This for instance can be achieved by simultaneously recording speed pulses.
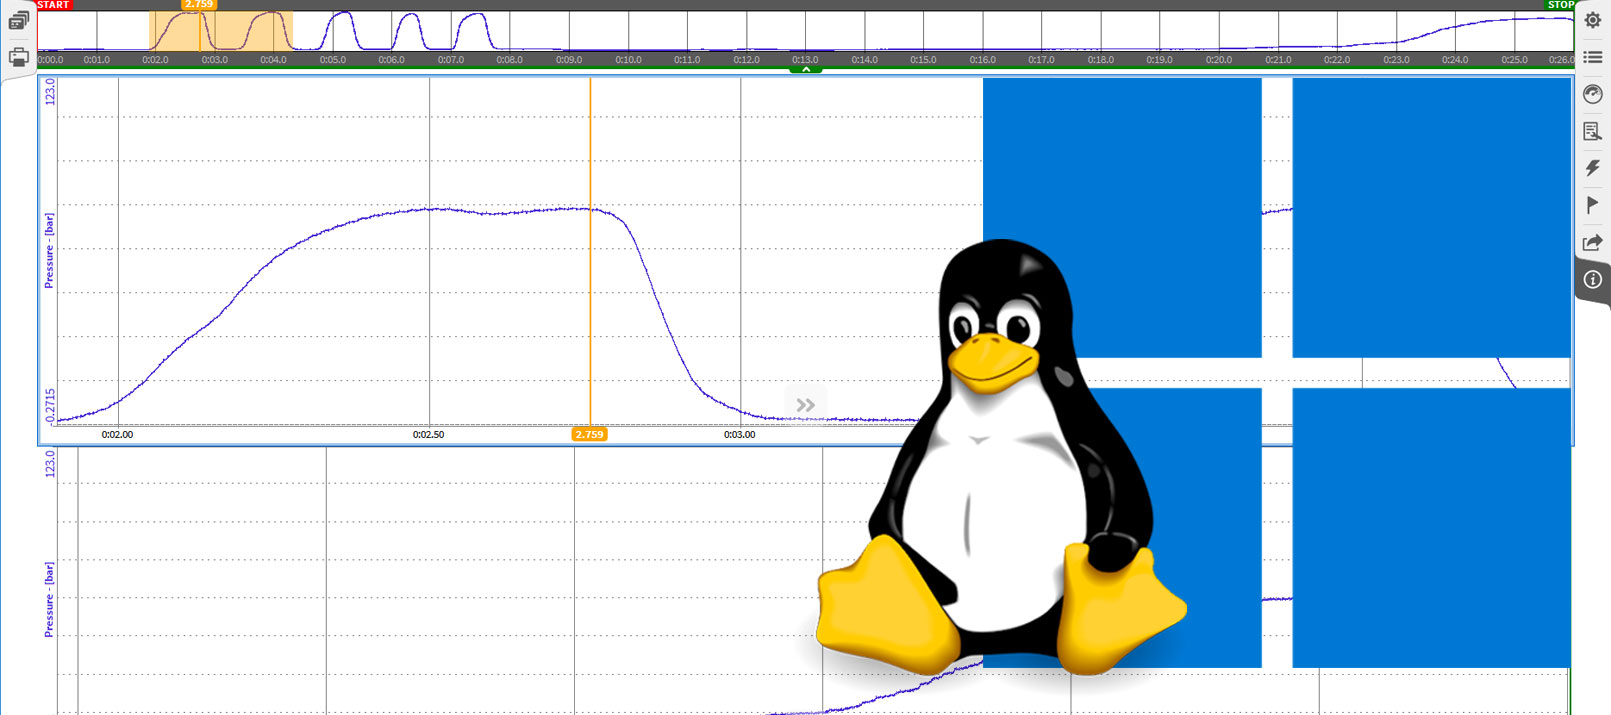
Once we have identified a single rotation (corresponding to the first order), we apply a tracking algorithm to track the frequency variations of each order over time. Therefore, we separate the vibration signal into signal blocks per revolution, where one block represents one revolution (Fig. 2).

Fig 2: Separation of vibration signal (blue) into single blocks according to the angular signal (green).
To improve the final outcome and avoid inaccurate results, we apply further filtering (e.g. anti-aliasing filter), smoothing, and resampling operations. Finally, we transform each single block into the frequency domain using a Fast Fourier Transformation (FFT). This results in a power spectrum for every angular velocity [rpm].
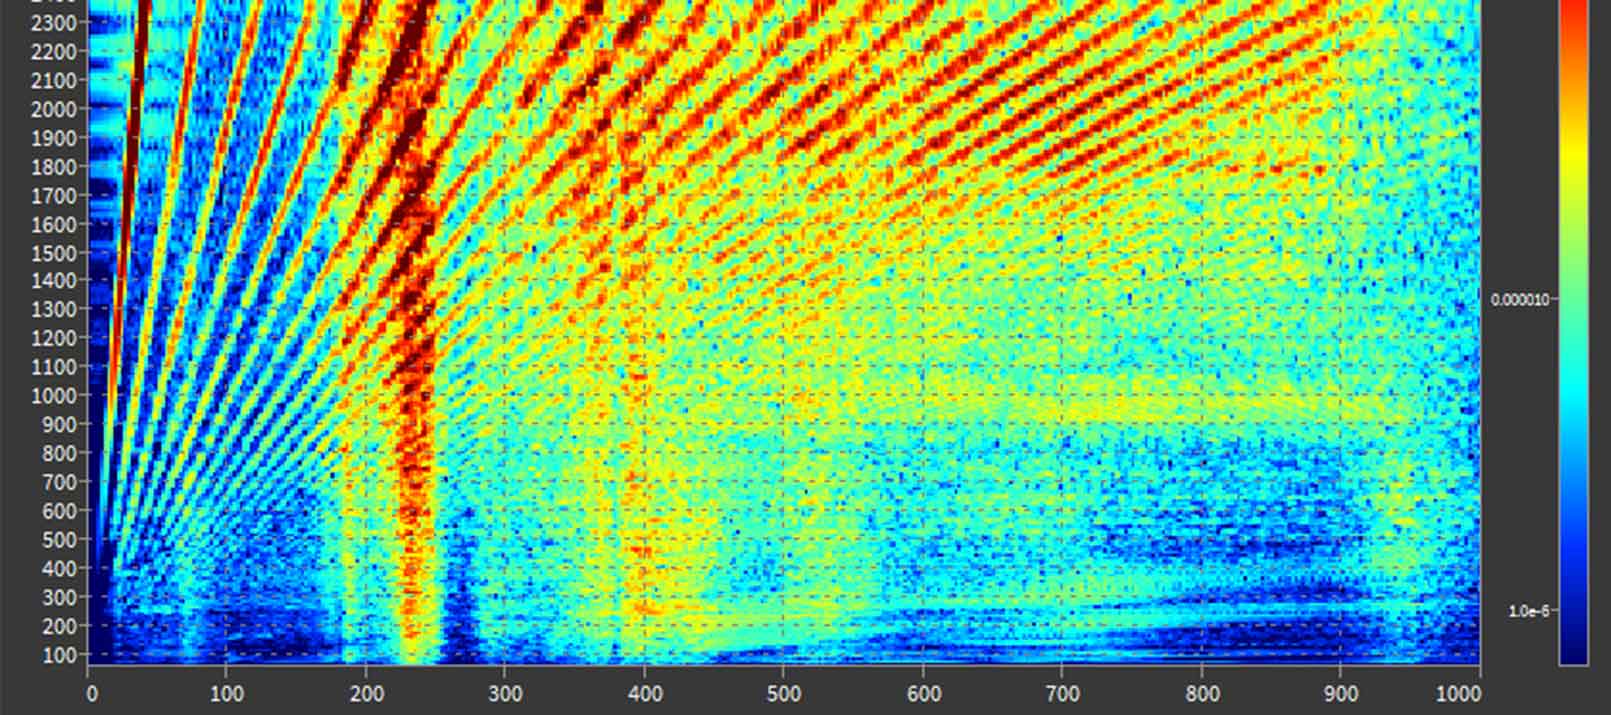
The results can then be visualized in the form of various plots (see Fig. 4). However, in order tracking, we usually use a 2D-color plot representing vibration intensity as color in the spectrum vs. RPM. This spectrum can be visualized as a frequency spectrum or as an order spectrum. The order spectrum links the frequency components in the acceleration signal to the orders of the mechanical speed. This allows visually tracking the order at various rotation speeds in the order spectrum representation and tracking the frequency components in the frequency spectrum representation (Fig. 3).

Fig 3: Left: frequency spectrum vs RPM; Right: order spectrum vs RPM.
Why is it important?
Order analysis is a powerful tool that finds use in machinery diagnostics to analyze the noise and vibration of rotating machines. It provides critical insights into the health, stability, and potential issues within a rotating system. In the following, we list multiple specific reasons why order analysis may come in handy:
- Detection of misalignment and bearing faults:
Misalignments and bearing faults can show up as specific patterns in the order spectrum. Analyzing these patterns helps to identify and handle the issue at hand. - Determination of unbalance:
Unbalance in rotating machines can lead to vibrations. In such a case, order analysis allows to quantify the amount and phase of unbalance at specific orders. Thus, enabling corrective measures (e.g. balancing the rotor) to be taken. - Resonance detection:
Resonance is a phenomenon, where the natural frequencies of the rotor coincide with specific orders, which leads to vibrations. Order analysis helps to detect and mitigate resonance. - Optimization of maintenance strategies:
Order analysis facilitates predictive maintenance by identifying early signs of potential issues. Changes in the order spectrum over time, predict when maintenance activities, as for instance balancing or alignment adjustments, are likely to be necessary. - Real-time monitoring:
When integrated into condition monitoring systems, order analysis provides real-time feedback. This allows for immediate response to emerging issues.
So overall order analysis offers a comprehensive understanding of the entire rotating system. It helps to interpret vibrations, diagnose potential problems, optimize performance, and ultimately ensure the reliability and efficiency of rotating machinery.
Where is it used?
Simply put, once there is a rotating system, order analysis becomes a useful and beneficial tool. Therefore, order analysis is widely used in various industries. Here are some application examples:
- Aerospace industry:
For aircraft engines, order analysis is used to monitor the health and performance of rotating components such as turbines and compressors. - Automotive industry:
In the automotive industry, it is used to evaluate the dynamics of rotating components in engines and drive systems. - Manufacturing:
In manufacturing environments, it is used to assess the health of rotating machinery such as pumps or motors. - Renewable energy:
Wind turbines and hydroelectric generators utilize order analysis to evaluate the condition of rotating components. - Power generation:
Further, it is crucial in power plants, where turbines and generators are central to electricity generation. - Oil and gas Industry, mining industry, rail transportation, etc.
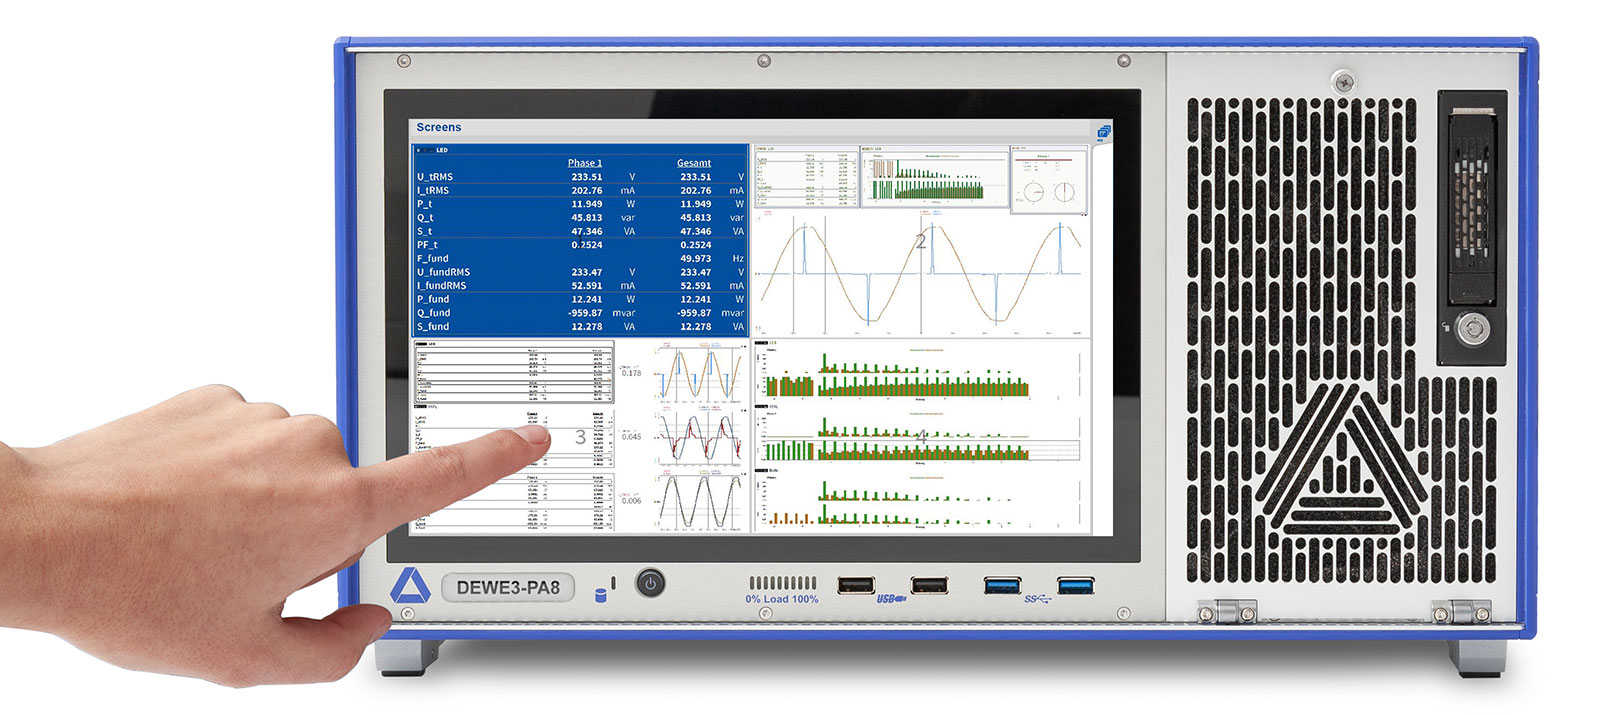
Order analysis with OXYGEN
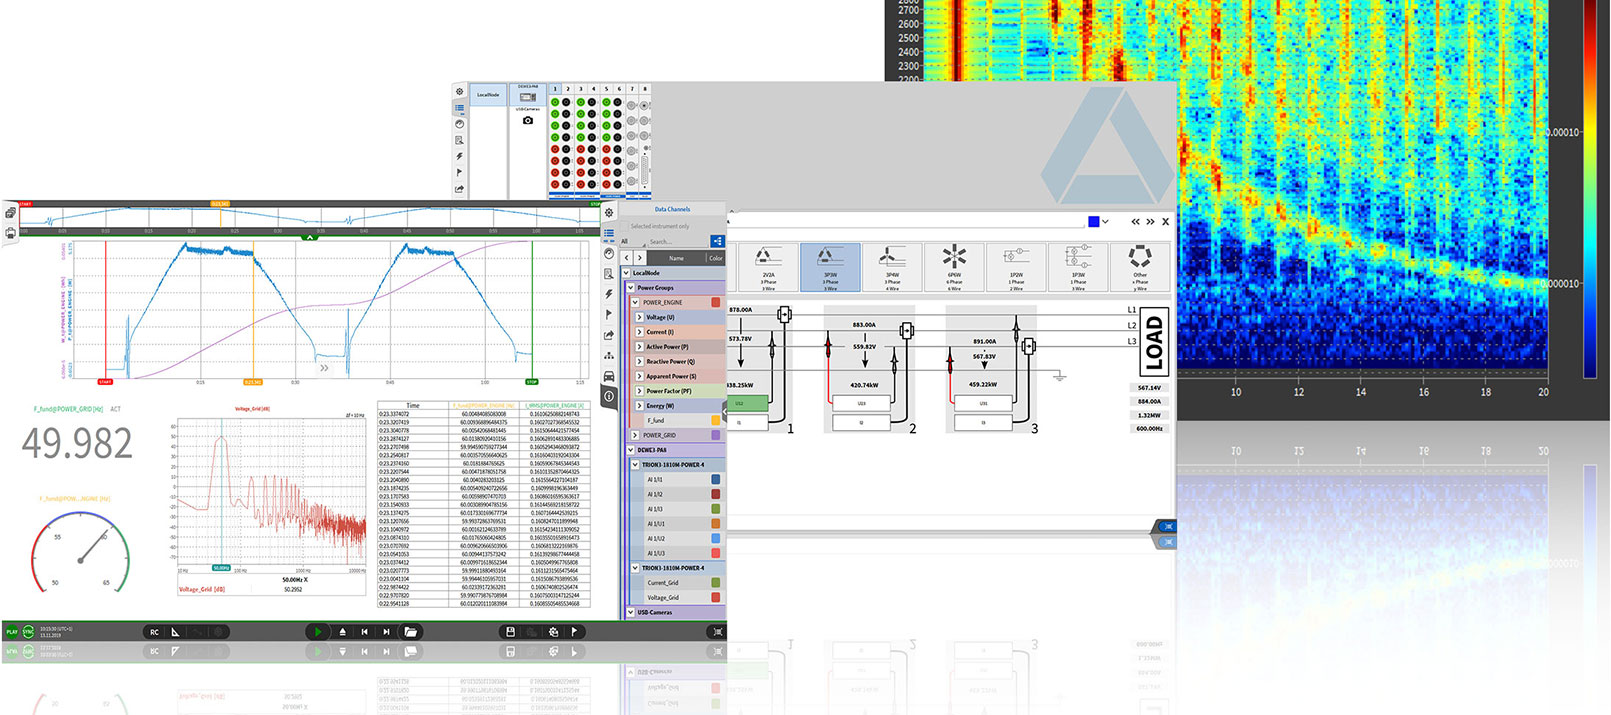
OXYGEN is our comprehensive yet easy-to-use measurement software. The software is not only designed for data measurement but also provides countless analysis and visualization tools. This also includes an order analysis instrument for calculation and visualization of frequency and order spectra vs. speed. In addition to spectrograms and intensity diagrams, many more functions are available, like the extraction of desired orders for a more detailed analysis.
Note: The order analysis feature of OXYGEN is an additional software option and is not included in the basic version of OXYGEN.

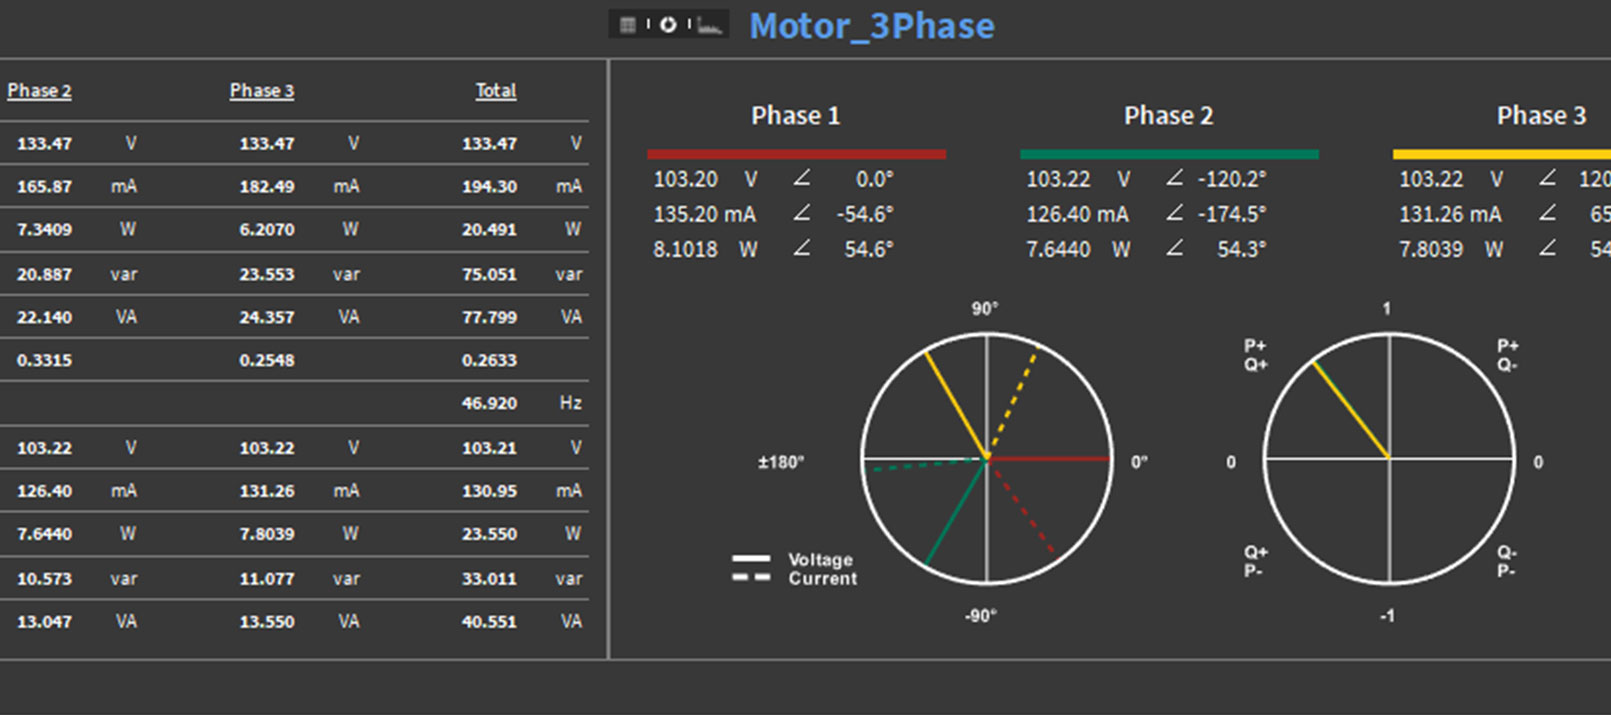
Fig 4: Example of order analysis visualization via OXYGEN.
DEWETRON’s order analysis option in action
In the following videos, we show an entire application scenario to demonstrate the usability and functionality of this feature. To showcase a real-life scenario, the first video depicts the measuring and investigation of rotational vibrations. The second video then demonstrates the order analysis of the collected signal.
You are currently viewing a placeholder content from YouTube. To access the actual content, click the button below. Please note that doing so will share data with third-party providers.
More InformationDownload our OXYGEN software now free of charge and test it and its various analysis tools. However, keep in mind that the free version of OXYGEN is limited to 30 seconds of continuous measuring time. Nevertheless, it is still possible to test all calculation and analysis features. And in case you require bigger datasets, you can also download multiple demo data in the following link.
You are currently viewing a placeholder content from YouTube. To access the actual content, click the button below. Please note that doing so will share data with third-party providers.
More InformationTo summarize:
Order analysis (also called order tracking) is a powerful analysis tool for rotating and vibrating machinery and system components. It examines specific frequency components called “orders”, which represent harmonics related to the rotational speed of the machinery. The basic process involves the FFT of vibration data from the time domain to the frequency domain. This allows to identify and visualize the respective orders and helps diagnose issues like misalignment, unbalance, and many more. As such, it is an indispensable tool for ensuring the reliability and efficiency of rotating machinery across several industries.