Frequency Analysis in Signal Processing

Many physical phenomena, such as vibration, acoustics, or electrical signals, are inherently frequency-based. When measuring such events, raw data contain not only the main signal, but also additional information such as noise sources, resonances, and harmonics. These characteristics are often difficult to identify in a purely time-domain representation. However, they are relatively easily detected via frequency analysis.
In this blog post, we take a closer look at the basics of frequency analysis, common methods, typical use cases, and how our measurement software OXYGEN supports frequency-domain evaluation.
What is frequency analysis?
To better answer this question, let’s take a step back. In signal processing, continuous signals are not only analyzed in the time domain, but usually in the frequency domain as well. While time-domain data shows how a signal changes over time, frequency analysis reveals which frequencies are present and how strongly they contribute to the overall signal. For a comprehensive understanding of a measured signal, the signal should be examined in both the time and frequency domains.
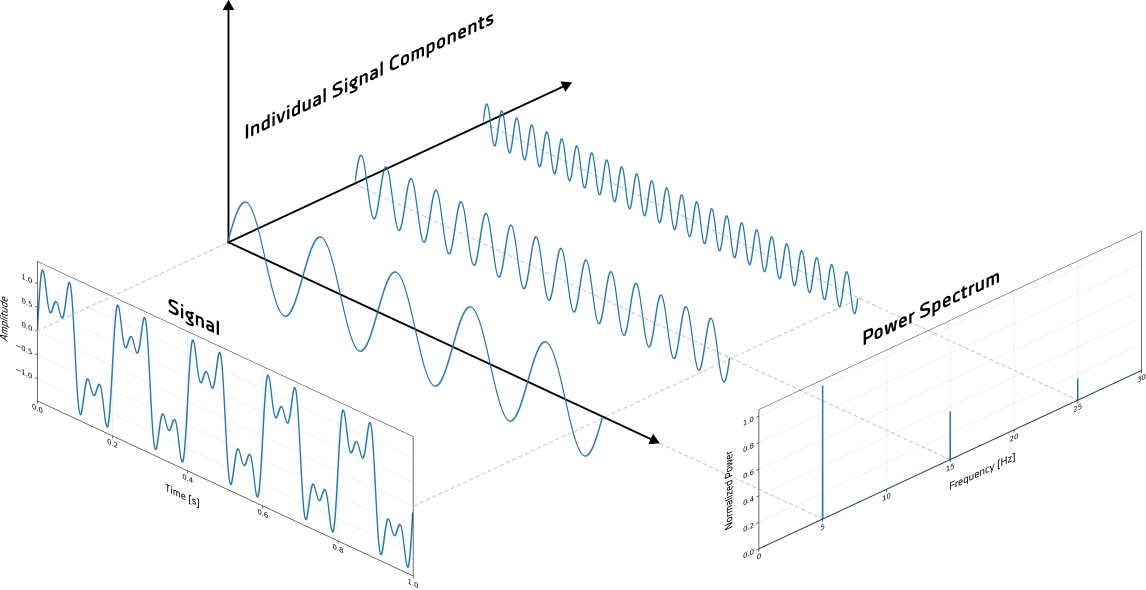
Fig. 1: Signal shown in the time domain (left), broken down into its individual components (center), and visualized in the frequency domain (right)
So, what does that mean in practice? Simply put, frequency analysis breaks down complex signals into their fundamental frequency components. Instead of examining the behavior over time, it focuses on the frequency content of a signal. This approach makes it possible to identify periodic behavior, dominant frequencies, harmonics, resonances, and other signal characteristics that are often hidden in raw time-domain data.
How does frequency analysis work?
Various mathematical techniques can be used to analyze the frequency content of a signal. The choice of method largely depends on the application and the type of information that needs to be extracted. Some analyses focus on identifying dominant frequencies, others on tracking how frequency content changes over time or under varying operating conditions. By far the most common and fundamental tool in frequency analysis is the Fourier Transform and its practical implementation, the Fast Fourier Transform (FFT).
What is Fast Fourier Transform & FFT?
The Fast Fourier Transform (FFT) is a mathematical transformation that converts a time-domain signal into its frequency-domain representation. Instead of showing how a signal evolves over time, it reveals which frequencies are present and how strong they are.
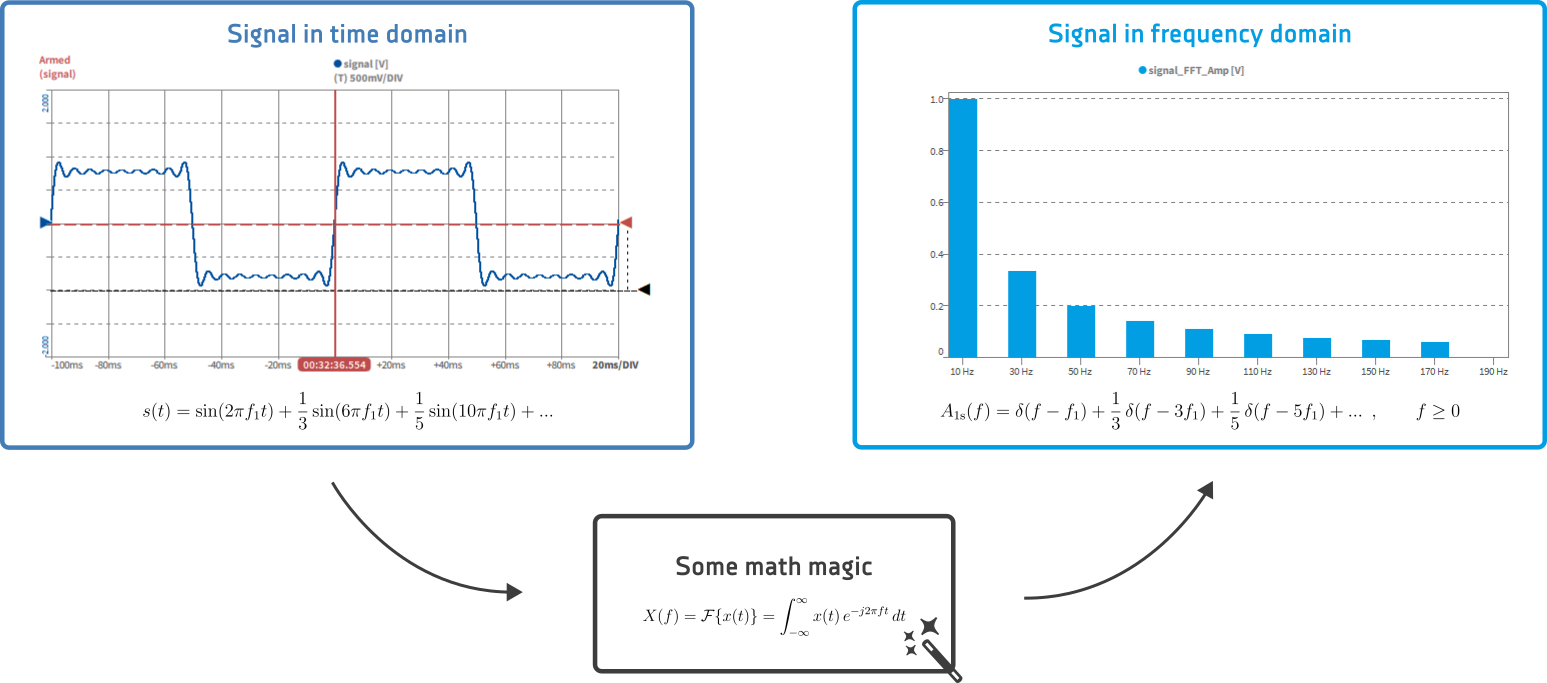
Fig. 2: Left: rectangular signal composed of multiple sine-wave components; center: Fourier transformation from time to frequency domain; right: resulting one-sided frequency spectrum showing only positive frequencies
The FFT is an efficient algorithm that enables this transformation to be performed quickly, even for large datasets. The result is typically displayed as an amplitude or power spectrum.
What are Typical Mathematical Tools and Analysis Methods?
Many advanced frequency analysis methods build on the FFT and combine it with additional mathematical processing to extract more detailed insights. Common examples are:
- Amplitude and power spectra
Show how strongly different frequencies contribute to a signal, making dominant frequencies and harmonics easy to identify. - Spectrograms
Visualize how frequency content changes over time, combining time and frequency information in a single view. - Order and harmonic analysis
Analyze frequency components relative to rotational speed or a fundamental frequency, commonly used for rotating machinery and power systems. - Frequency-domain filtering
Isolate or suppress specific frequency ranges to focus on relevant signal components or reduce unwanted noise. - Windowing and averaging techniques
Improve spectral accuracy and stability by reducing noise and minimizing spectral leakage in frequency analysis.
Where is Frequency Analysis used and why?
Frequency analysis is essential wherever dynamic, oscillatory, or periodic behavior plays a role. Its ability to reveal information hidden in the time domain is not limited to a specific industry or use case. It is a fundamental tool across many fields. Here are some basic examples across various industries:
Automotive & Mobility
- NVH analysis of engines, drivetrains, and electric motors
- Identification of order-related effects and resonances
Aerospace & Structural Testing
- Modal analysis and resonance detection
- Structural vibration and fatigue analysis
Power & Energy
- Harmonic analysis in power grids
- Detection of disturbances and power quality issues
Manufacturing & Condition Monitoring
- Early detection of bearing or gearbox faults
- Frequency-based health monitoring of machinery
Acoustics & Noise Analysis
- Identifying dominant noise sources
- Evaluating frequency-weighted sound levels
Scientific Research
- Analyzing stellar oscillations and periodic signals from celestial objects in astrophysics
- Detecting seismic waves and studying subsurface structures in seismology
Medicine
- Analyzing ECG and EEG signals to identify cardiac or neurological patterns
- Evaluating ultrasound signals and physiological rhythms
Communications
- Analyzing modulation schemes and signal bandwidth
- Detecting interference, noise, and spectral congestion
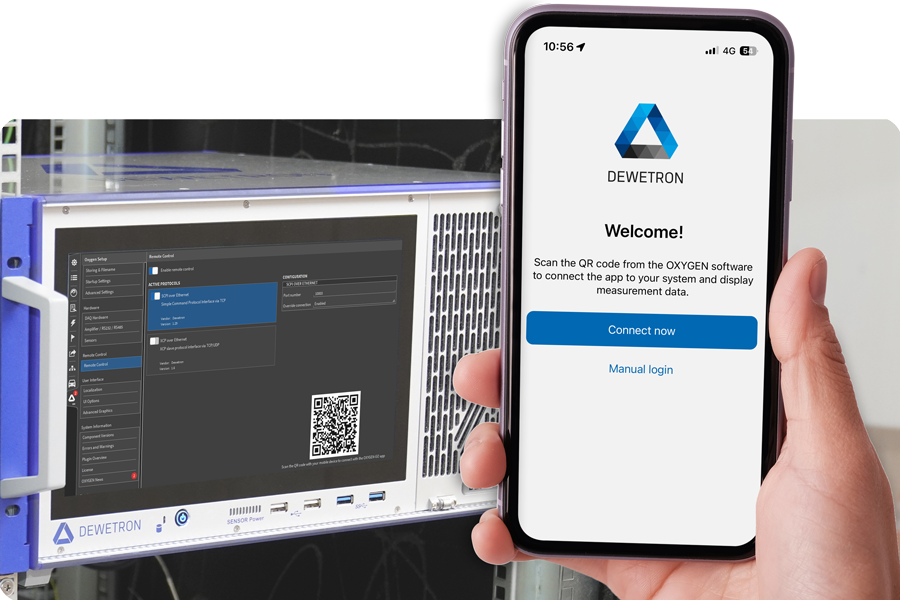
How to do Frequency analysis in OXYGEN?
Since signal acquisition, processing, and analysis are at the core of what we do, our in-house measurement software OXYGEN, naturally offers a comprehensive set of frequency analysis tools.
These range from intuitive visualization and analysis instruments – such as the Spectrum Analyzer and Spectrogram – to flexible filtering options for isolating relevant frequency ranges or suppressing unwanted signal components. OXYGEN also provides various analysis tools, including FFT, STFT, and CPB analysis, as well as more advanced methods such as modal testing, order analysis, sound level analysis, and more.