What is modal testing?
The modal test is used to determine the natural frequency, mode shapes or damping ratios of structures or objects. The modal test is a crucial process, particularly in the field of construction technology and mechanical engineering. From the automotive industry to aerospace, modal testing plays an important role in ensuring the integrity, safety and performance of individual components and entire structures. In this blog post, we explain the basics of modal testing, its application and relevance in engineering. You will then find a quick guide to our modal test option, which is available with the OXYGEN 7.0 release.
What is the modal test for?
The modal test is a form of vibration test that makes it possible to experimentally determine the modal parameters of a structure. The modal test is used, for example, to analyze aircraft parts, chassis, engines, wind turbines or to validate any other structural parts. Especially important modal parameters are:
Natural (or modal) frequencies
They represent the frequencies at which a structure tends to oscillate when subjected to a dynamic load without any external forces. These frequencies are inherent to the system and depend on its mass, stiffness, and damping characteristics.
Damping ratios
They quantify the rate at which vibrations in a structure decay over time. Damping is essential for understanding energy dissipation and the stability of the system under dynamic loading conditions.
Mode shapes
They represent the spatial distribution of displacements or deformations within a structure at certain natural frequencies. They provide information about the vibrational patterns and dynamic behavior of the system.
In contrast to modal analysis, which focuses on parameter analysis, modal testing prioritizes data acquisition. While modal testing includes various methodologies, impact testing is one of the most common techniques. This involves applying a controlled mechanical force via an exciter to the Device Under Test (DUT) and measuring the resulting response. Typically, a modal-hammer is used to exert this controlled force. These hammers feature IEPE sensors integrated in their striking surfaces, enabling precise force measurement. Meanwhile, the response of the DUT is captured using accelerometers or other vibration sensors.

Fig. 1 Examples for modal hammer from PCB Piezotronics
Depending on the Device Under Test (DUT), the test setup, and the testing environment, the optimal approach involves using either single or multiple exciters along with single or multiple response sensors. This offers three distinct and useful test configurations:
 |
1. Single-Input-Single-Output (SISO): In SISO tests, a single exciter (e.g., hammer) and a single sensor are employed. The operator can choose to either move the exciter while keeping the response sensor fixed or vice versa. Depending on the specific application, this setup is referred to as a moving hammer or moving sensor test. |
 |
2. Single-Input-Multiple-Output (SIMO): SIMO setups involve a single (moving) exciter and multiple sensors capturing the response. This configuration allows for the simultaneous measurement of a single excitation at various sensor locations, offering comprehensive data about the DUT’s behavior. |
|
| 3. Multiple-Input-Multiple-Output (MIMO): In MIMO configurations, multiple exciters and multiple response sensors are utilized. Typically, shakers serve as exciters in MIMO tests, providing versatility and enabling the assessment of complex interactions within the DUT across different excitation points and response locations. |

In the event of resonance, an amplification of the response becomes visible in the response spectra. Based on this response spectra, in combination with the force spectra it is possible to obtain a transfer function more specially the frequency response function (FRF), which is the parameter of interest. The FRF then allows to quantify the relationship between input and output signals at each frequency. There are various algorithms for calculating the FRF, all of which are generally performed in frequency space, as this significantly simplifies the entire calculation. For detailed information on the different calculation algorithms, check our modal test manual.
Download the modal test technical reference

Fig. 2: Schematic representation of modal test theory with:
f(t) … input signal; F(ω) … frequency spectra of input signal; x(t) … response signal; X(ω) … frequency spectra of response signal; h(t) … impulse response; H(ω) … Transfer function
Advanced analysis techniques such as the Mode Indicator Function (MIF) or curve fitting can enhance the understanding of Frequency Response Functions (FRFs) by facilitating the estimation of modal parameters. While MIF evaluates FRFs across all excitation pathways to identify modes, curve fitting estimates modal parameters such as natural frequencies or damping coefficients. However, since MIF and curve fitting are inherent parts of modal analysis and not modal testing, this blog post will not delve further into these analysis techniques.
What are modal test applications?
Modal testing and further modal analysis are common tools implemented across various engineering disciplines and industries. Here are some notable examples:
Automotive
In the automotive sector, modal testing evaluates the vibration characteristics of vehicle components and chassis systems, crucial for ride comfort and durability analysis.
Civil engineering
Modal tests allow to assess the dynamic behavior of large structures such as buildings, bridges, dams, or other structures under wind, seismic, or operational loads.
Aerospace
Modal tests play a central role in the analysis of the dynamic behavior of aircraft components such as wings, fuselage and control surfaces and contribute to the optimization of aircraft structures.
Mechanical systems
Modal testing measures the vibration modes of machines and industrial systems. In the further course, this helps to prevent fatigue failure and optimize performance.
Modal testing with OXYGEN
With the release of OXYGEN 7.0 we implemented modal testing into our intuitive measurement software OXYGEN. This enables SISO & SIMO tests with moving hammer and moving sensor, plus the calculation of the complex transfer function, the coherence of several hits and the Mode Indicator Function (MIF). Additionally, we implemented various interactive visualization options and the import possibility of 3D geometric models.
In the following we provide a step-by-step quick guide on how to use modal testing in OXYGEN with DEWETRON measurement systems. For a comprehensive instruction refer to the technical reference once more.

Fig. 3: Schematic step-by-step representation of modal testing in OXYGEN
Quick guide – modal test
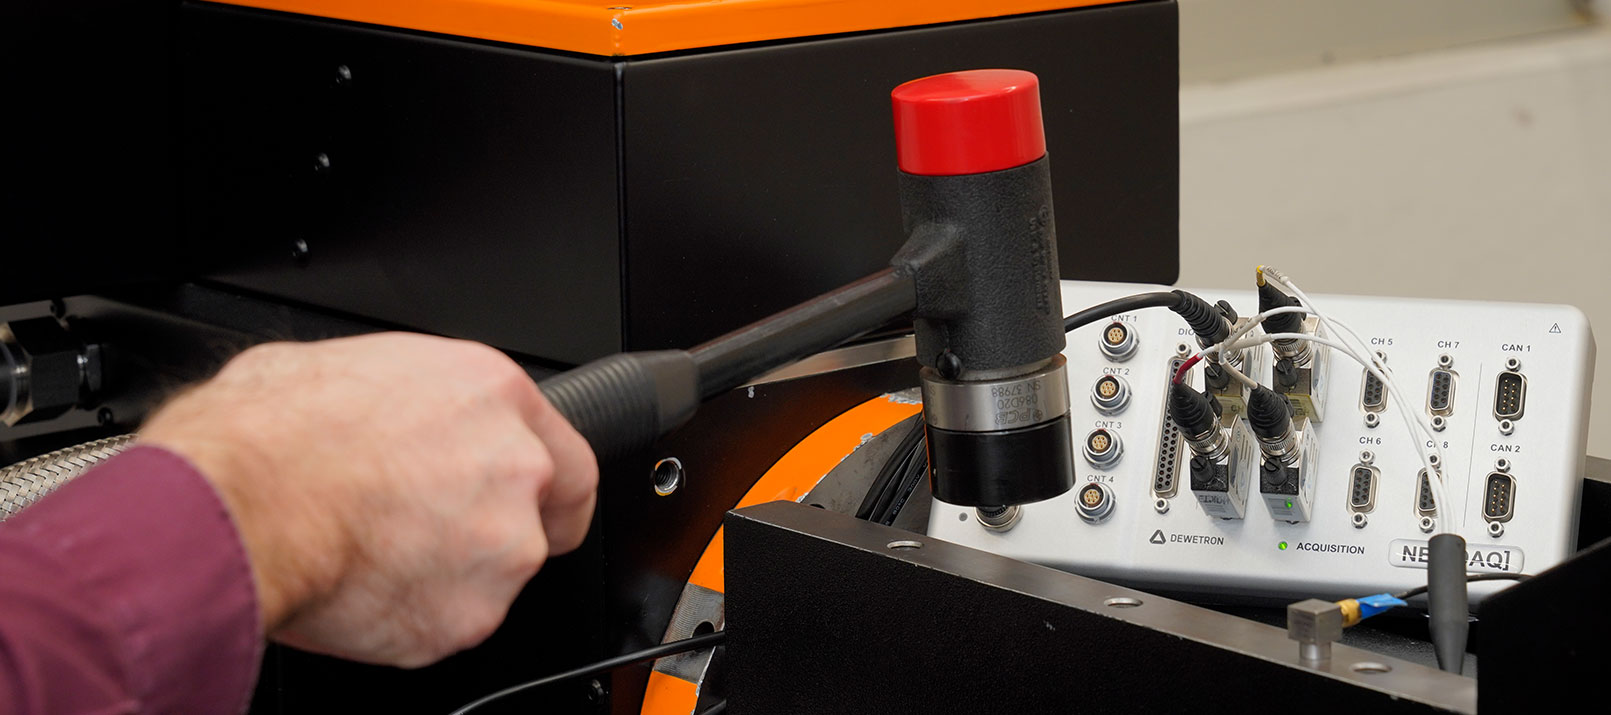
Modal tests with OXYGEN 7.0 are so easy: in this video, our product manager Rafael Ludwig uses a test setup to show you how easy it is to take measurements with our software option. A test bench is used as the device under test. The system is excited with a modal hammer and the response signals are measured at several positions with an accelerometer. The signals from the sensors are recorded by our data acquisition system NEX[DAQ].
You are currently viewing a placeholder content from YouTube. To access the actual content, click the button below. Please note that doing so will share data with third-party providers.
More InformationStep to step guide – How to setup modal testing in OXYGEN
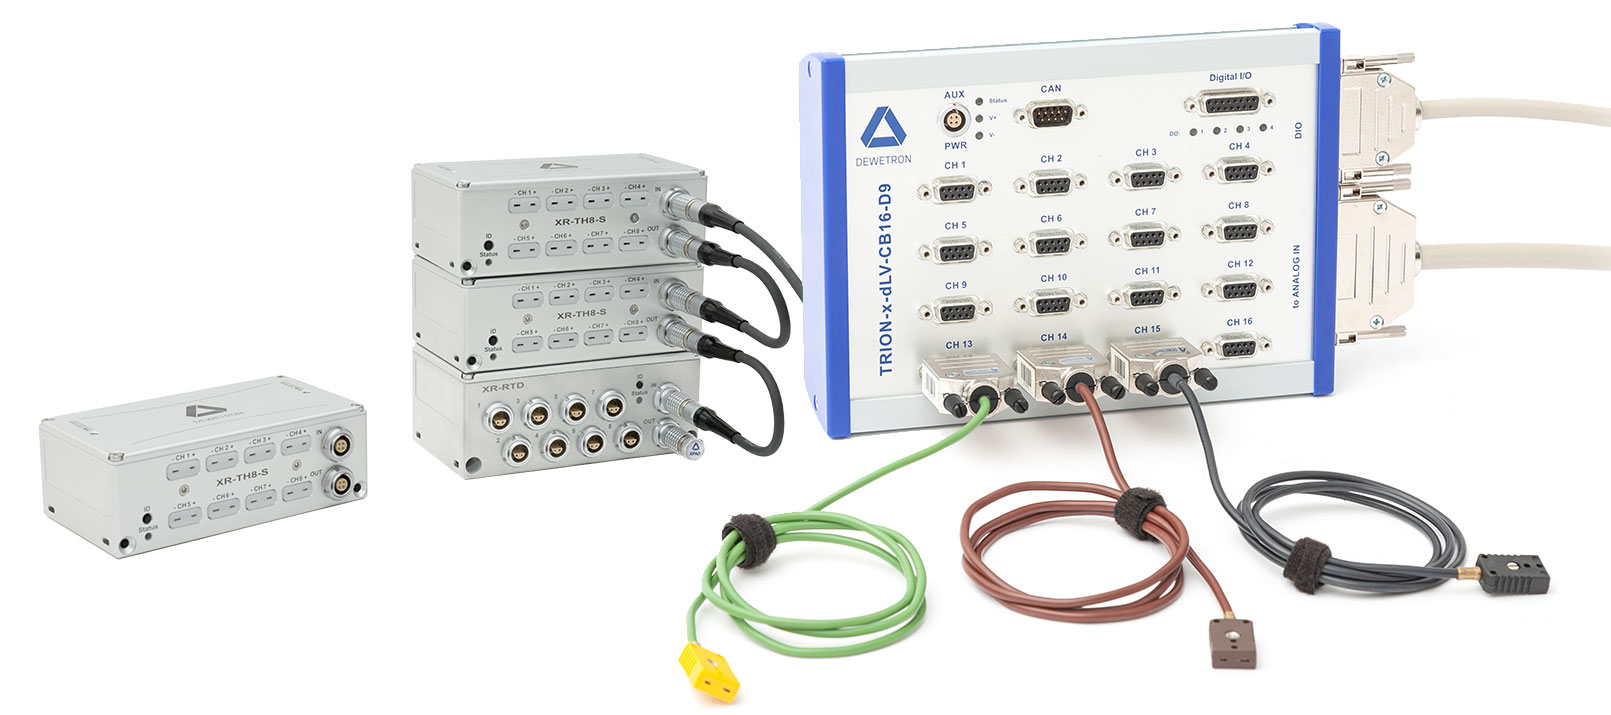
Step 1 – Hardware connection:
The first step is to connect all response sensors and the excitation hammer to the DEWETRON measurement device, via for example a TRION-2402-dACC module in a TRIONet3.
Step 2 – Channel setup:
It is important to set up the data channels for excitation and response signals correctly. This includes selecting the correct mode, i.e. IEPE, and the sensor scaling/sensitivity. The scaling is important to obtain valid measured values for input and output signals that are neither too low nor too high. To reduce extraneous influences, a high-pass filter can be set in the “coupling”, which suppresses excessively low oscillations. Furthermore, zeroing in the form of a fixed value can be set. Fig. 4 highlights the abovementioned settings.

Fig. 4: Channel setup for modal tests
Typically, the signal response of an excitation signal is measured at a point in one or three spatial directions. If the response channels are named according to the nomenclature [0-999][XYZ][+-], a model test object can be generated directly from them.
Step 3 – Modal test setup:
To create a modal test, begin by selecting the designated response channels or create a modal test without any preselected channels. Next, define the test object either based on the selected response channels or by manually selecting the number of excitation and response positions with the corresponding spatial directions. Assigning the response channels to the intended response positions is the next essential step, which can be performed automatically or manually. Also ensure the assignment of the excitation channel in this stage. Finally, specify the trigger settings for the recording of excitation events, which include warnings when range limits are exceeded and an optional secondary hit warning. In addition, the FRF calculation type can be customized based on signal noise, allowing for flexible analysis approaches.
Step 4 – Measurement screen:
Customize the Modal Test screen template and display different data components, such as real or imaginary parts of the amplitude response, according to your specific requirements.
Step 5 – Arming the measurement:
Arm the trigger to enable excitation event recording. Adjust the threshold in trigger settings as needed. With these preparations complete, you are ready to commence recording.
Step 6 – TP #1:
Initiate recording and execute excitation at the first excitation point.
Step 7 – Data verification:
Assess the validity of measured data after each excitation. Depending on the test setup, multiple hits per point may be required, each evaluated individually. Successful hits are denoted by a green-colored bar in the group frame. The group frame is located in the bottom-left of the measurement screen as displayed in Fig. 5. Additional color indicators are:
- red: range exceeded warning
- orange: range warning
- pink: double hit warning
Continue the excitation process until all events for designated position are successfully completed.

Fig. 5: Validation of hit by color indication
Step 8 – TP#i:
Proceed to the next excitation point and execute excitation.
Step 9 – Data evaluation:
Review data and repeat until testing is complete. Stop recording once finished. Fig. 6 displays an example of a successful execution. It further provides an overview of the primary test screen.

Fig. 6: Universal modal test screen
| ① Create Modal Test Screen: Creates a new screen based on a Modal Test template every time you click. | ⑨ Recorded signal of excitation channel. |
| ② Active: Toggle the trigger to record an excitation event. | ⑩ Spectra of excitation channel (FFT). |
| ③ Reject: Successive deletes data of last excitation event until all events are deleted. | ⑪ Live data of response channels. |
| ④ Single: Shows data of the active hit in amplitude response and phase shift response plot. | ⑫ Recorded signal of response channels. |
| ⑤ MIF: Display the mode indicator function in the coherence plot. | ⑬ Spectra of response channels (FFT). |
| ⑥ Excitation groups: Select the active excitation group to measure/view/discard. | ⑭ Amplitude response: Spectrum of amplitude ratio between response and excitation. |
| ⑦ Trigger groups: Select active hit of active excitation group. | ⑮ Phase shift response: Spectrum of phase shift between response and excitation [°]. |
| ⑧ Live data of excitation channel. | ⑯ Coherence function: Similarity between excitation and response of recorded events. |
Note: OXYGEN’s “Modal Test” option is optional and therefore not included in the OXYGEN standard license.
Modal test in a nutshell
Modal testing is a method used to experimentally determine the natural frequencies, mode shapes, and damping ratios of a structure or mechanical system. Through controlled excitation and measurement of the system response, engineers can gain insights into its dynamic behavior. Modal testing is an important tool in numerous industries, including manufacturing, automotive, aerospace and many more. To support all these different areas, we have integrated an easy-to-use modal test tool into our OXYGEN measurement software. This tool enables fast SISO and SIMO measurements with immediate display of the excitation signals, response signals, MIF and coherence function.