What types of measurement errors are there?

If there is one dogma that every metrologist, engineer or scientist is familiar with, it is probably the following: The statement of a (physical) measurement result without the statement of a measurement error is worthless.
As harsh as this statement may sound, it is true. Every measuring device and every measurement contains sources of error. The specification of a measurement error (measurement uncertainty) provides information about the quality of the measurement and its specification is absolutely necessary. For example, if the result of a voltage measurement is 5 V ± 3 V, the true value of the voltage can be as high as 8 V or as low as 2 V. If one omits the measurement uncertainty, it is not possible to give any information about the deviation of the measured value from the true value.
In practice, however, it is actually the case that one omits statements of measurement uncertainties completely. This is simply because the uncertainties are assumed to be irrelevantly small. Nevertheless, one should always be aware of this. Yet, measurement uncertainties do not imply a shortcoming or are a negative criterion. They should rather be seen as a kind of quality assurance, which allows a certain evaluation of the measured value (and points to potential improvement possibilities).
In measurement technology, there are different types of measurement errors. The two most significant are the systematic measurement uncertainties and the random (statistical) measurement uncertainties. In this blog post, we will go into more detail about what distinguishes these two types of uncertainties.
Systematic measurement uncertainties
Systematic measurement uncertainties, sometimes referred to as built-in errors, are uncertainties that occur systematically. This means, they lead to a shift of the measurement result in a specified direction. This shift is also called offset.
An example of systematic measurement errors is a mechanical clock that, due to a construction flaw, always ticks a little too fast. Therefore, if you use this watch to stop for example a marathon, you will always get a wrong result. However, this result can be easily adjusted since it is of a systematic nature. If it is possible to find out this systematic deviation, e.g. by comparing the mechanical clock with a more accurate atomic clock, one can simply correct the measured value. In the technical language one calls this adjustment.
In many cases, however, one is sure that the own measuring device has been adjusted correctly. Nonetheless, other systematic measurement errors can occur. To avoid these, one must be aware of the underlying causes. There are many causes for systematic measurement errors. You can find some of them in the following list:
- Missing or incorrect adjustment of the measuring device
- Effects such as temperature change, aging or wear and tear
- Unsuitable environmental conditions: sloping surface, humidity, exceeding the permissible operating conditions of the measuring device
- Reaction or undesired interaction between measuring device and measuring object
- Factors not taken into account, such as magnetic fields or frictional forces
The term systematic measurement uncertainty is strongly related (but not necessarily identical) to the term trueness. We wrote a blog post about trueness, precision, and accuracy here.
Statistical measurement errors
You are sure that you have excluded all systematic measurement uncertainties, but your measurement results still seem to differ for every measurement? Possibly the reason is a random measurement error.
Random measurement uncertainties are random in nature and cannot (or hardly) be influenced. Imagine you want to stop a marathon run with a very accurate stopwatch. The watch is accurate, but you are not. When the runner crosses the finish line, you will (due to your reaction time) sometimes read off the time a little too early, sometimes a little too late. There is little you can do about this error and since the direction of the deviation is random, one sometimes also calls it statistical deviation.

Comparison between random and systematic error
The random measurement error from above is probably very small if you compare it to a whole marathon. In many cases, however, the statistical uncertainty is significantly larger and may even exceed the systematic error. Causes for statistical uncertainties could be:
- Uncontrollable environmental influences such as temperature fluctuations.
- Irregular behavior of the measuring instrument
- Uncontrollable changes of the measured object (not every marathon run lasts the same time)
Random measurement errors are strongly related to the concept of precision. Again, you can find more information on this in our blog post on trueness, precision, and accuracy.
How to specify measurement errors
Systematic measurement uncertainties can in theory be determined exactly and a clear value can be assigned to them. Therefore, they are often specified with absolute error limits such as 5 V ± 3 V. This means that the true value lies with certainty between 2 V and 8 V.
Such an indication is not possible for random measurement deviations, since they occur randomly. Therefore, the possible size of the measurement deviation is not limited. The deviation can assume both: very large and very small values. Due to this, one can only specify so-called σ-confidence intervals. These σ-confidence intervals define the probability that the measured value is in the mentioned interval. You can see a few examples here:
- 5 V ± 3 V with 1σ confidence interval ….. The true value is with 68 % in the interval 5 V ± 3 V
- 5 V ± 3 V with 2σ-confidence interval ….. The true value is with 95 % in the interval 5 V ± 3 V
- 5 V ± 3 V with 3σ-confidence interval ….. The true value is with 99.8 % in the interval 5 V ± 3 V
To reduce random measurement errors, one can simply perform the same measurement several times. The more often you perform the measurement, the more certain you are that the true value (which one best describes by the mean value of the measurement series) lies in the given interval. Additionally, the uncertainty of the mean value decreases with increasing number of measurements.

Random measurement error with confidencce intervalls
DEWETRON – Measuring systems with highest accuracy
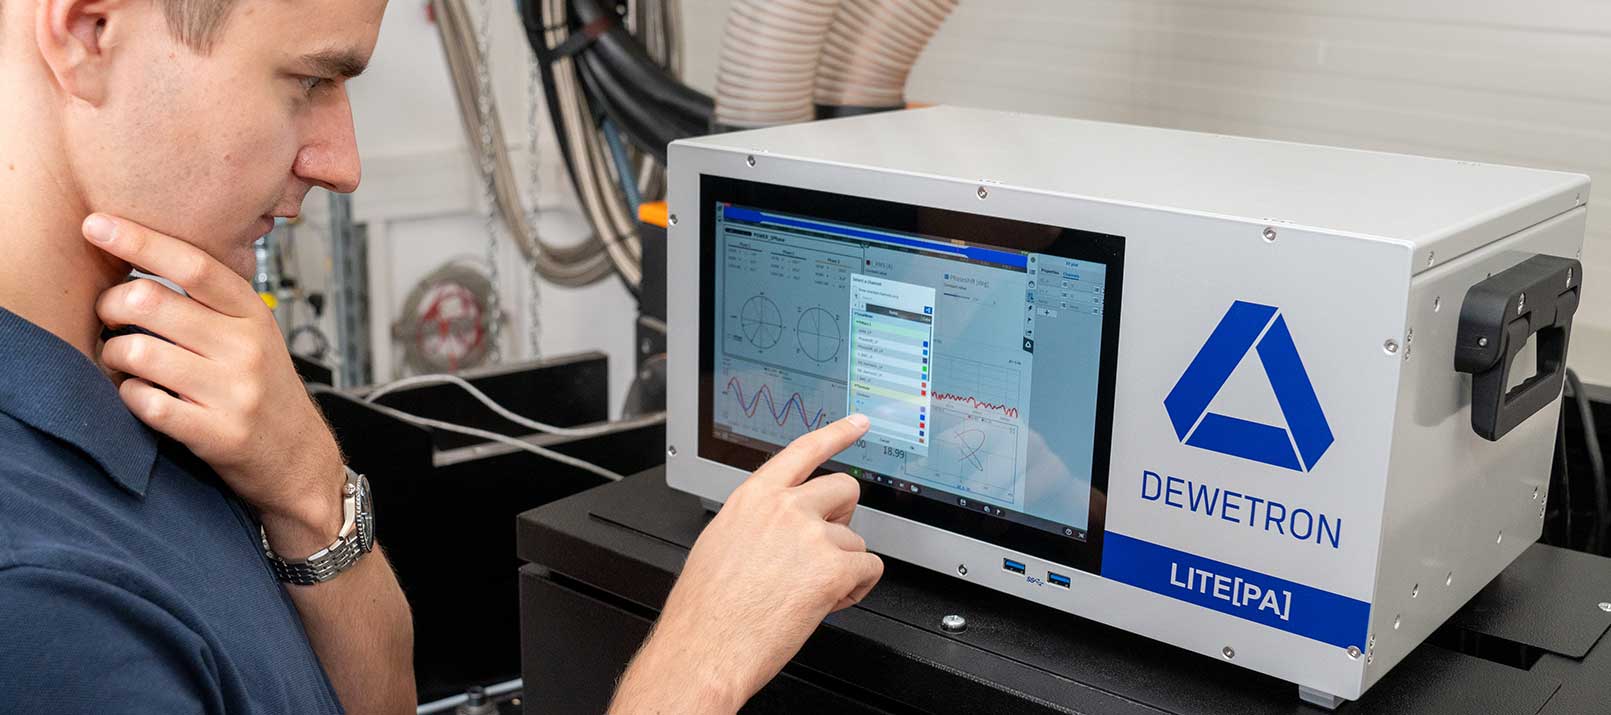
Imagine you had a measuring device with a measurement uncertainty of only 0.03 %. If you were to measure a voltage of 10 Vpeak with this measuring device, you would only have an incredibly small measurement deviation of ±0.003 V. Now imagine that you could easily order such a measuring device.
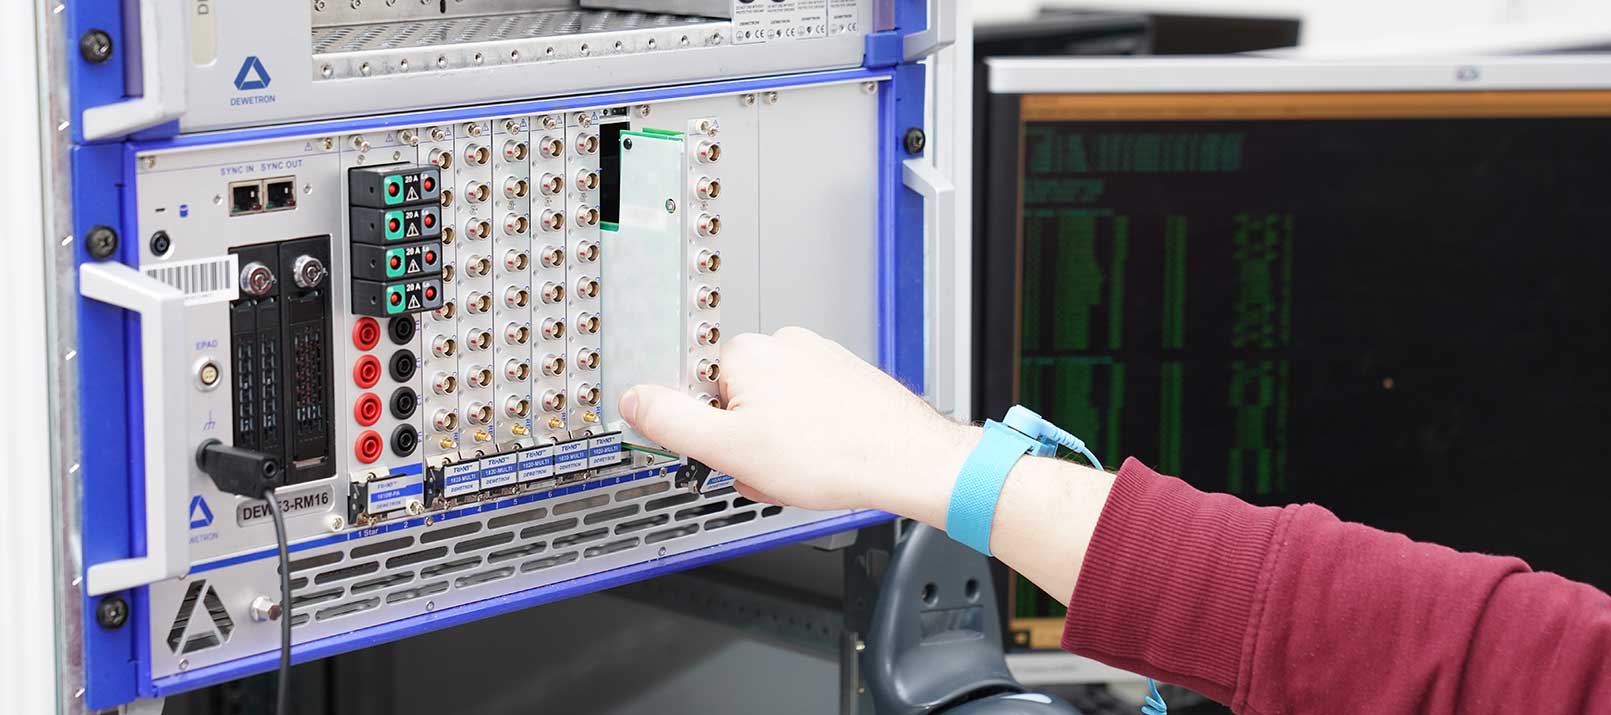
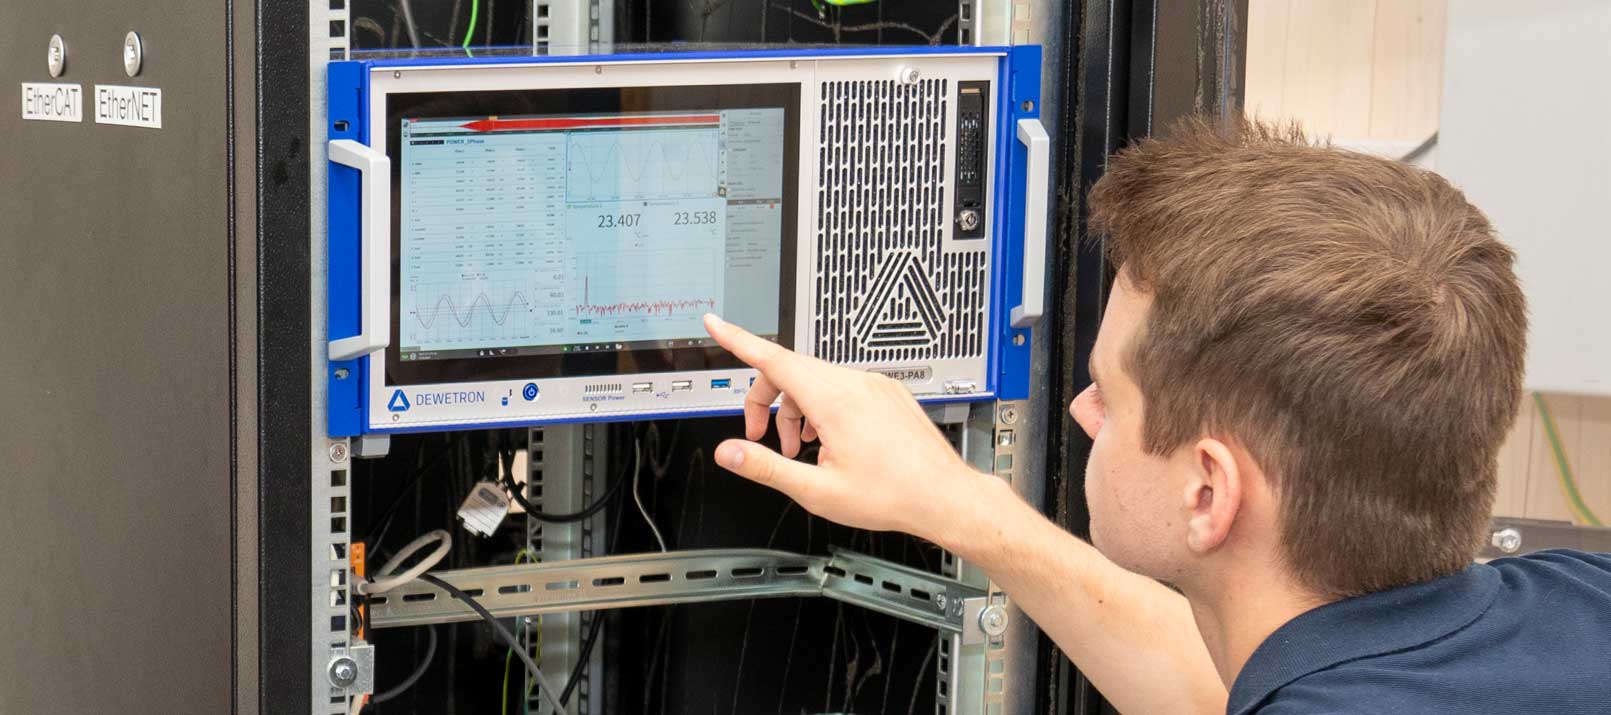
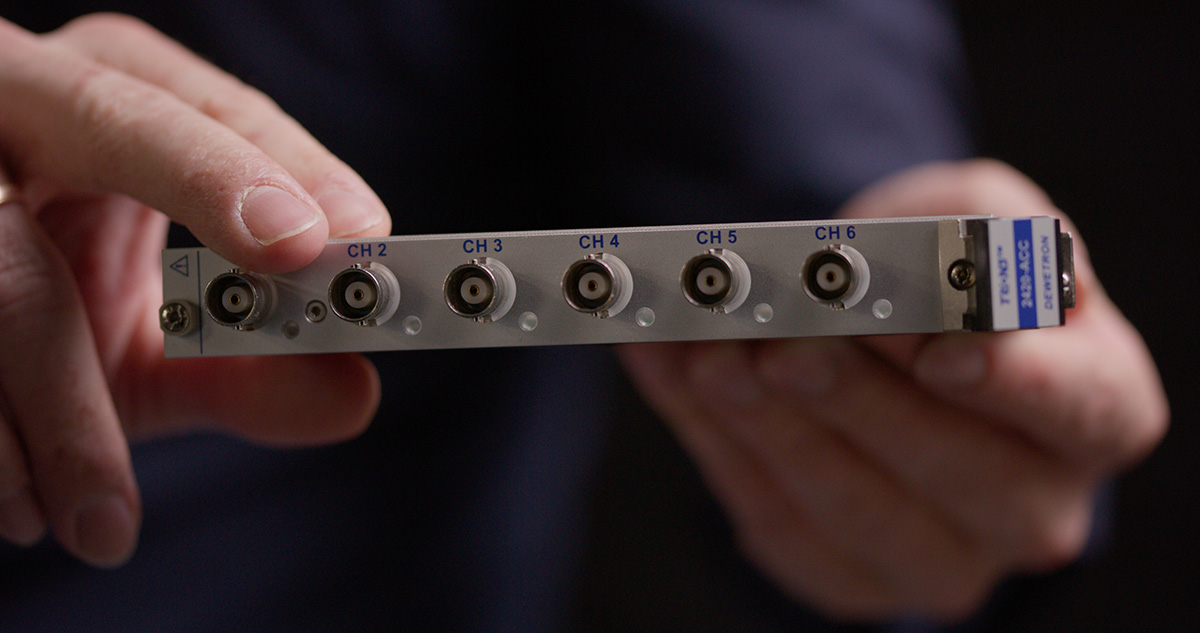
We are DEWETRON, a manufacturer of high precision and modular customizable measurement systems. Our Mixed Signal Power Analyzer comes with a measurement error of only 0.03 % and with a range of interchangeable TRION(3) measurement modules. As an affordable alternative to our Mixed Signal Power Analyzers, our innovative but price-effective entry-level-systems are also suitable.