OXYGEN's instruments & features explained - Part II
The structure of OXYGEN is simple: DEWETRON provides you a variety of instruments with many features and functionalities. You, on the other hand, determine your requirements and choose the appropriate one. Therefore, we want to disclose the entire overview of instruments to give you a better understanding of the structure of OXYGEN.
However, please mind that this article is already the second part of our series with the goal to portray the structure of OXYGEN. Hence, we also recommend one of our previous blogposts (Overview of Instruments in OXYGEN – Part I).
Structure of OXYGEN – Working with a wide range of instruments
In OXYGEN 5.4, you can use a range of 21 different instruments. Therefore, we prepared two articles that exclusively illustrate the structure of OXYGEN. The goal of this post is to present the following instruments:
- Spectrum analyzer
- Video
- XY plot
- GPS plot
- GPS quality
- Spectrogram
- Power
- Intensity diagram
- Array chart
- Audio player
- BirdsEye
In addition to that, you can find more information about the structure of OXYGEN in our last article. This previous post covered instruments like analog or digital meter, recorder, chart recorder, indicator, table, image, and some more.
Please mind that the number of instruments in OXYGEN is subject to the software version. Consequently, you can update your OXYGEN to the most recent software version in the download area in the customer care center. Moreover, if you want to upgrade your OXYGEN version, please get in touch.
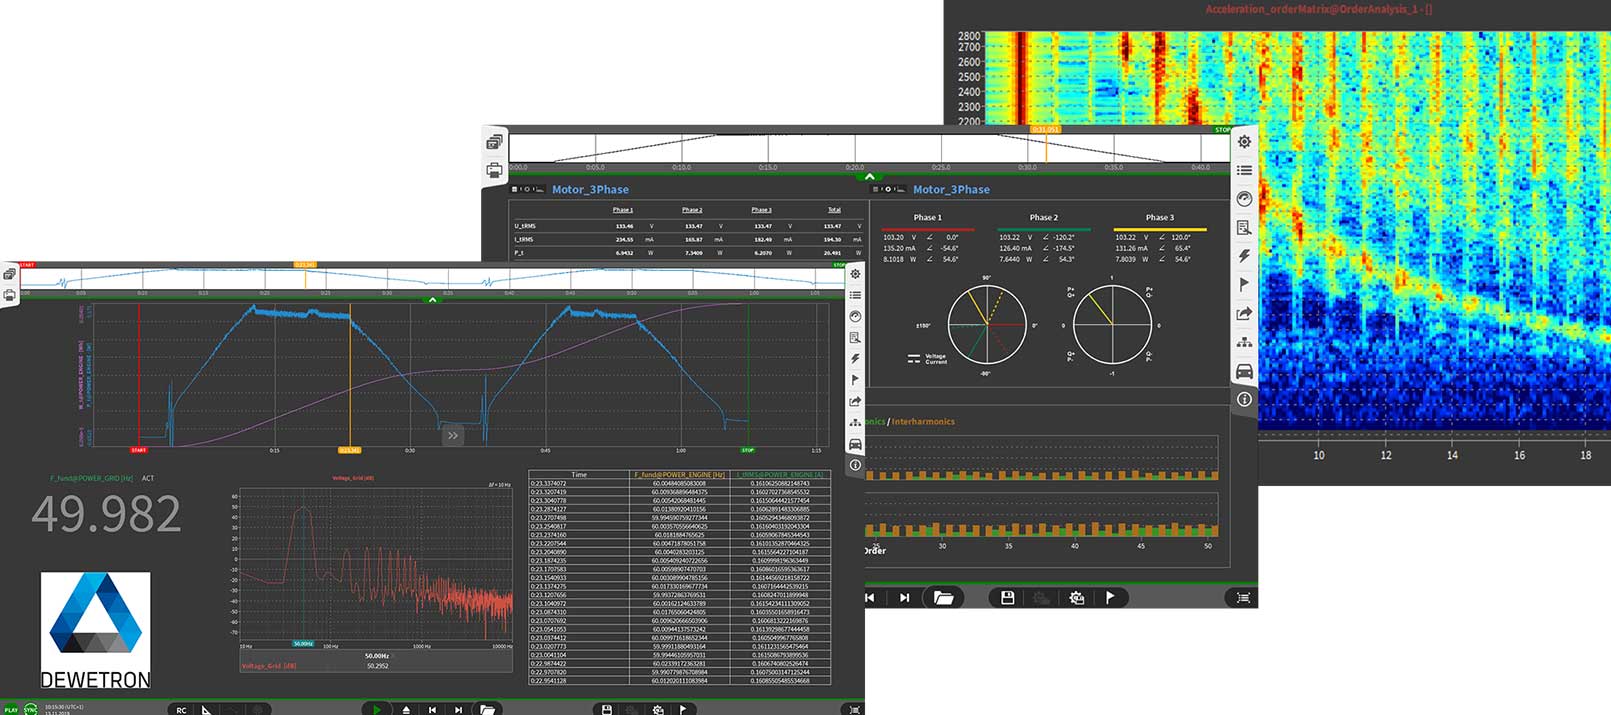
Spectrum analyzer
The spectrum analyzer is DEWETRON’s FFT instrument to allow the user to analyze data in real-time within the frequency domain. It is possible to assign up to eight channels to a single spectrum analyzer. This instrument offers a variety of useful features including:
- creation of reference curves (for threshold monitoring in the frequency domain)
- usage of individual or harmonics cursors
- assignment of time domain channels for spectral analysis
- assignment of frequency domain channels (display of mathematical frequency channels which are calculated using FFT math)
- selection from a wide range of different Window types and spectral amplitude types
- improvement of the line resolution and enable zero-padding
- normalization of FFT spectra
- calculation of a periodogram
As you can see, the spectrum analyzer instrument is a very powerful and comprehensive tool. Therefore, please refer to our OXYGEN software manual to learn more about the instrument.

Figure 1
Video
OXYGEN provides the possibility to acquire video data from webcams or GigE-cameras. For instance, the video instrument finds use in automotive applications when it is necessary to for instance record the test track. However, please mind that camera channels are not active by default in new setups. Simply open the data channels list and go to the video channels section to toggle the button to activate the channel.

Figure 2
XY plot
To analyze the dependency between two signals assigned to the X- and Y-axis, you can use the XY plot. One application example is the analysis of the DUT’s vibration or sound emission in the dependency of its speed. Thereby, you can adjust several instrument settings by your needs (e.g. scaling of the X- and Y-axis or the time interval history). During the use, you can assign nine channels to one single XY plot. This means you allocate one channel to the X-axis and eight channels to the Y-axis.

Figure 3
GPS plot
Thanks to DEWETRON’s GPS plot, users can display the GPS channel’s latitude, longitude, and heading (information could be acquired by TRION-TIMING or TRION-VGPS-20/100 module). Apart from raw hardware channels for latitude, longitude, and heading, you can also assign mathematical channels to the GPS plot (i.e. statistics channels for the previous three parameters).
For more information about our GPS plot, please refer to our OXYGEN software manual.

Figure 4
GPS quality
The GPS quality instrument displays the position of visible and used satellites of GNSS data (acquired by a TRION-TIMING or TRION-VGPS-20/-100 module), their signal’s SNR and further metadata. You can simply assign the NMEA data channel to the GPS quality instrument. Usually, the NMEA data channel is called GPS 1/1 per default and you can find it on the top of the GPS data channels list. Besides the satellites plot, the NMEA string contains the following metadata for the display in the GPS quality instrument: latitude, longitude, altitude, velocity, heading, satellite used, satellites in view, quality, and dilution.

Figure 5
Spectrogram
You may use the spectrogram to display the time-dependent signal trend of an FFT amplitude or phase channel which you previously created with the FFT math. Then, the X-axis displays the elapsed time while the Y-axis shows the frequency and the Z-axis represents the color-coded amplitude of the signal. However, this instrument is limited to only one FFT amplitude or phase channel.

Figure 6
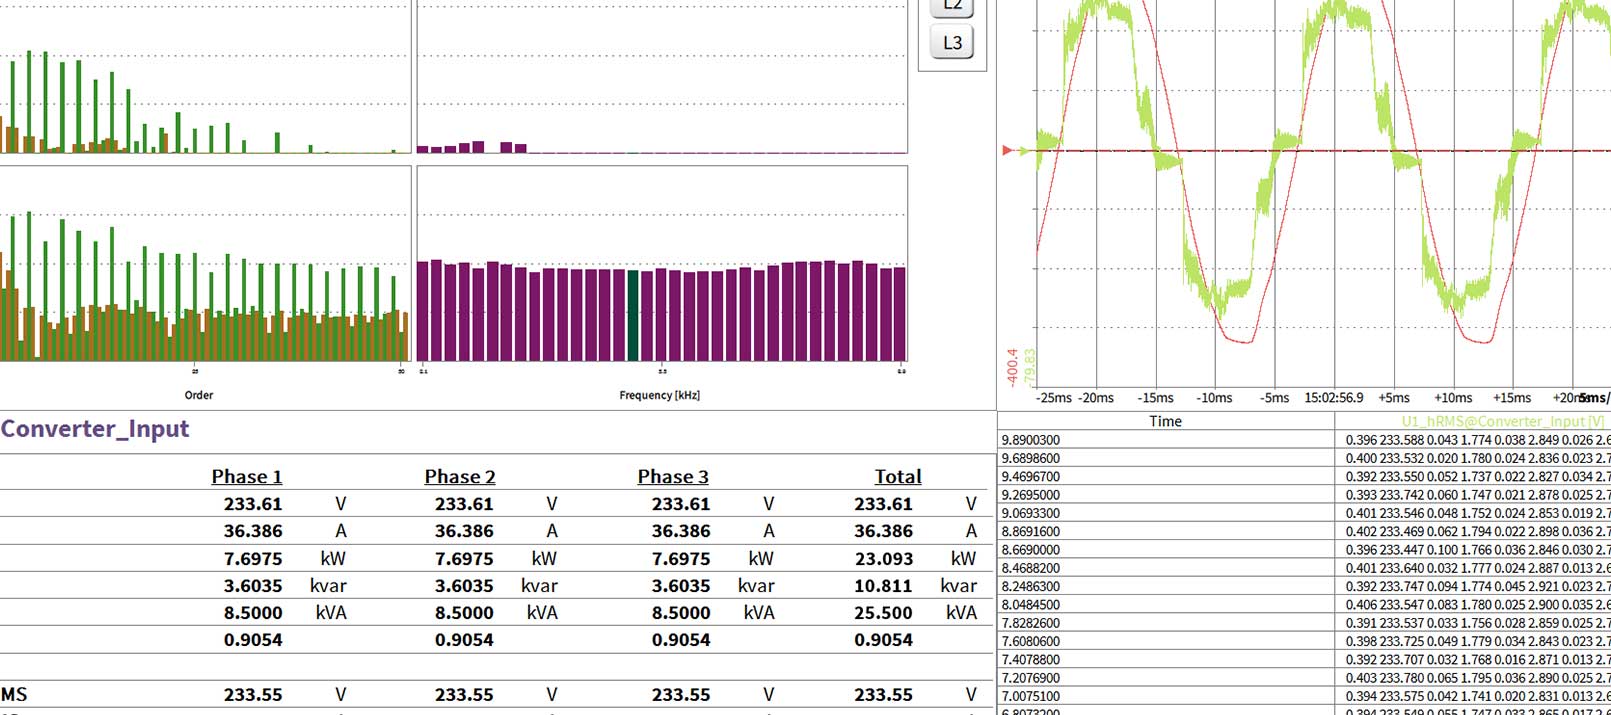
Power
The OXYGEN power instrument is the up-to-date power analyzer software add-on for DEWETRON’s measurement software OXYGEN. We already devoted several articles to our power features (OXY-OPT-POWER-BASIC and OXY-OPT-POWER-ADVANCED) like the previous post about power analysis or this one about power groups and power phases. For further information about OXYGEN’s power instrument, please refer to the dedicated technical reference manual in the manuals section of our customer care center (DEWETRON_OXYGEN_Power_Technical_Reference_Rx.x).

Figure 7
Intensity diagram
The aim of DEWETRON’s intensity diagram is to display the frequency and order matrix of an order analysis channel or the resulting matrix of a matrix sampler channel (i.e., an efficiency map). Thereby the structure of OXYGEN allows to adjust the instrument properties to the measurement’s requirements – similar to other instruments. Therefore, you can modify the orientation (horizontal, vertical), limits (min. and max. values), gradient as well as level of grading, level of color-coding, scaling, and style.

Figure 8
Array chart
To visualize the CPB (Constant Percentage Bandwidth) channels of a CPB analysis, you might use OXYGEN’S array chart. Additionally, the array chart can be used to visualize harmonic channels provided by the power group (such as the harmonics, interharmonics, higher frequency grouping or supraharmonics). Thereby, you can assign up to two channels to the array chart and adjust instrument properties to modify the display (e.g., show the min. or max CPB value, the total computation, the energetic sum or change the value axis).

Figure 9
Audio player
The audio player instrument replays OXYGEN channels via the systems’ default sound card. Thereby, the audio player provides the possibility to mute the channel(s) (output enabled), to set the output volume, and to change to left-right balance. Moreover, the audio player supports the replay of synchronous data channels (i.e. analog inputs and formulas). The audio replay functionality is available in LIVE, REC, and PLAY mode. In LIVE and REC mode, the actual data is replayed. In PLAY mode the replay is snapped to the position of the orange cursor.
Please mind: you can assign a maximum of two channels to the audio player. In addition to that, the signal’s sample rate must be within 1 kHz to 200 kHz.

Figure 10
BirdsEye
The BirdsEye is the visualization instrument belonging to the OXYGEN automotive plugin “BirdsEye”. Hence, it is the instrument to visualize automotive test scenarios and the position of all involved objects. Thanks to that, you can visualize a test scenario on an open street map or on a satellite image for the absolute reference on the proving ground. Thereby, all involved objects and their defined contours are visualized in LIVE, REC or PLAY mode. Furthermore, the position of moving objects is updated online based on their IMU data.

Figure 11