PU[REC] – Der Einstiegs-Power-Analyzer
INHALT
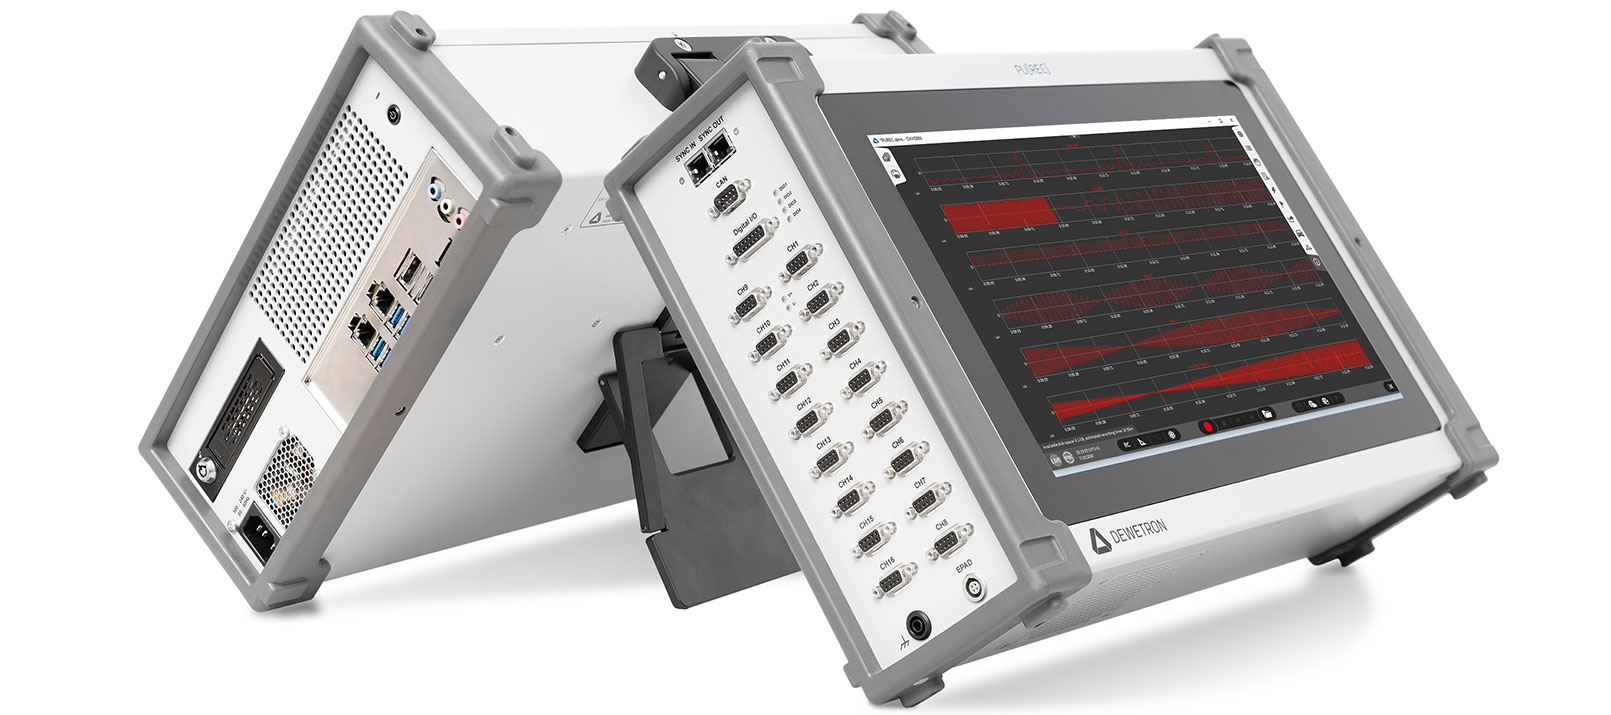
Einen erschwinglichen, präzisen, zuverlässigen und einfach zu bedienenden Power-Analyzer zu finden, ist keine leichte Aufgabe. Die Lösung heißt PU[REC] – der Einstiegs-Power-Analyzer, der genau auf Ihre Anforderungen zugeschnitten ist. Dieses Whitepaper gibt Einblicke in die Anwendungsbereiche und Vorteile des PU[REC], dem Mixed-Signal-Power-Analyzer von DEWETRON:
- Rohdatenerfassung mit bis zu 200 kS/s
- Interne 1-TB-SSD (kontinuierliche Aufzeichnung von bis zu 7 Tagen bei 50 kS/s)
- 16 Kanäle
- Benutzerfreundliches Windows-Betriebssystem
- Mixed-Signal-Ansatz (Messung von Temperatur, Druck, Luftfeuchtigkeit etc.)
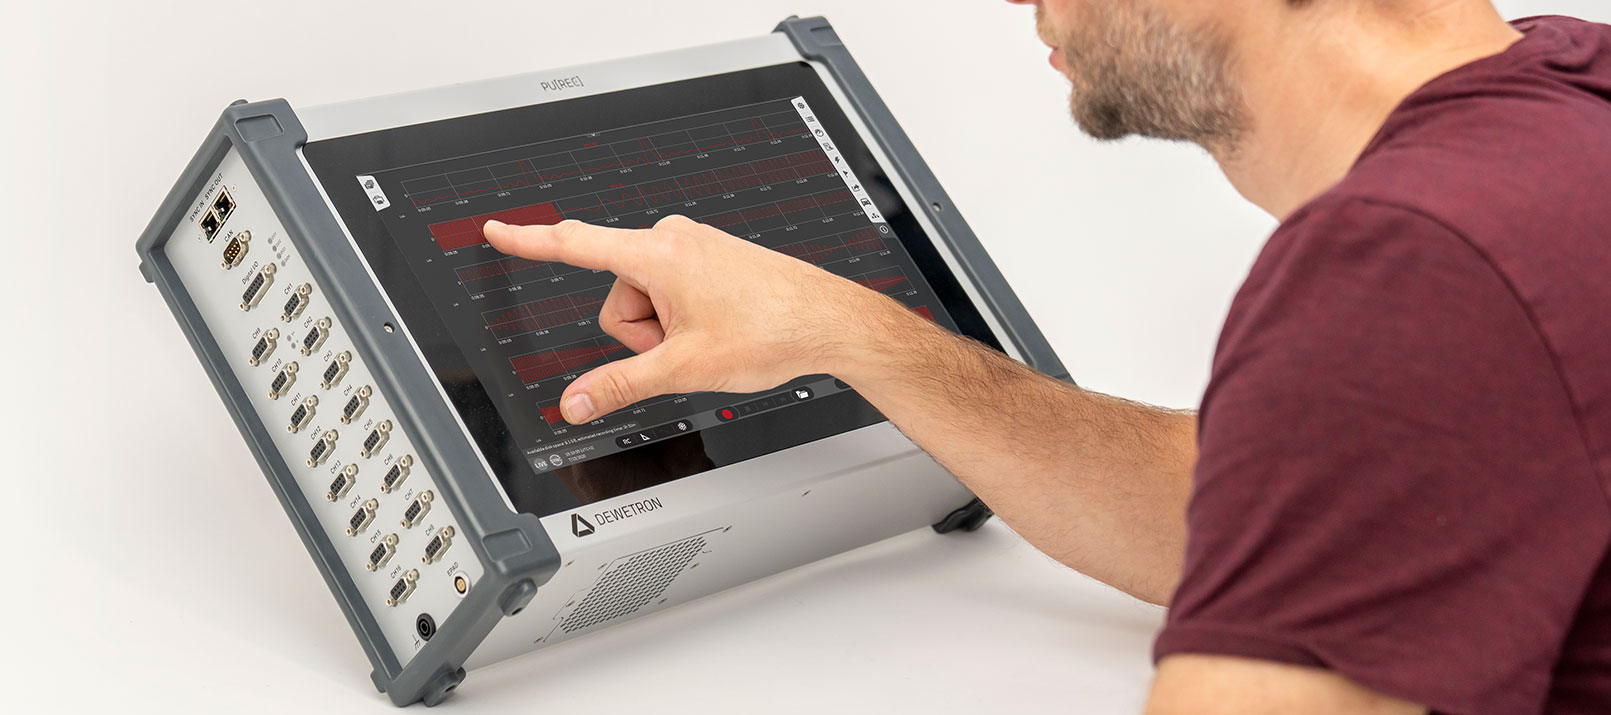
- 15,6″-Multi-Touch-Full-HD-Display
- Tragbar mit Tragegriff (Gewicht: 7,3 kg)
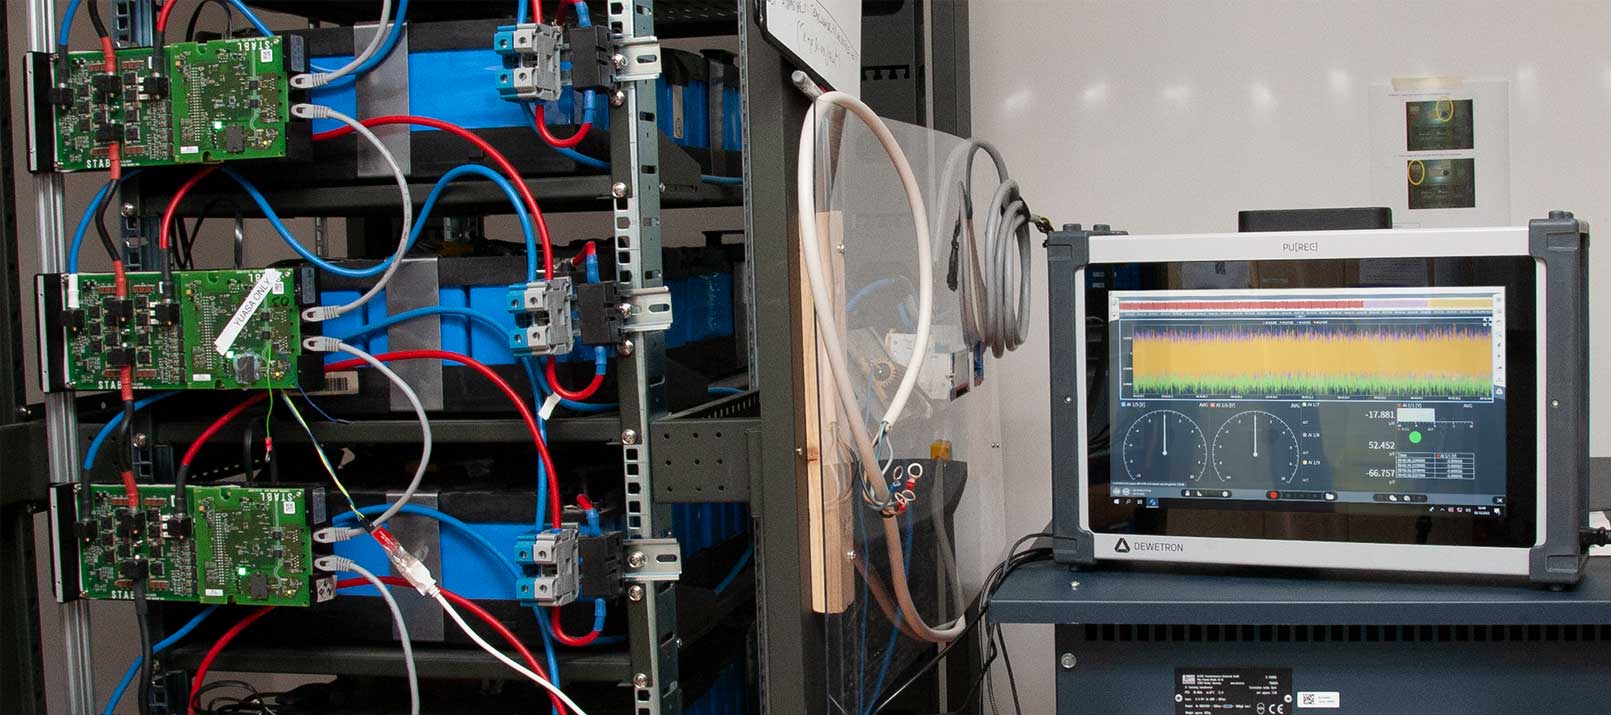
Der PU[REC] geht über die üblichen Aufgaben der elektrischen Leistungsmesstechnik hinaus und eignet sich auch für cloudbasierte Überwachungslösungen. Ein namhafter Hersteller von gewerblichen Küchengeräten nutzt den PU[REC] in einer cloudbasierten Lösung für eine 24/7-Überwachung der Netzqualität bei dreiphasigen ohmsch-kapazitiven Lasten.
WICHTIGE INFO: Das Whitepaper ist nur in Englisch verfügbar.